Browsing the archives for the election results tag.

Posting elsewhere: Mapping election results in Budapest; photos of New York City, then and now

European Politics, History, International Politics, US culture

Elsewhere online:

Comments Off on Posting elsewhere: Mapping election results in Budapest; photos of New York City, then and now

Regional elections in France and the National Front scare: After the run-off

European Politics, International Politics, Politics

It’s a great relief for any democrat that Marine Le Pen’s Front National (FN) failed to win any region, after having led in six after the first round, and after Le Pen herself had prognosticated that the FN could win “four or five regions”. That would have been disastrous, not just in terms of policy but as signal of a new stage of far-right penetration, at a time when the politics of xenophobia is on the rise across Europe.
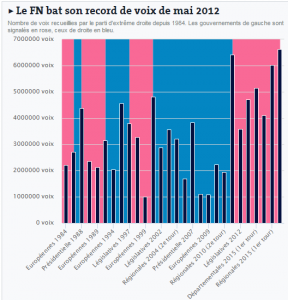
Record number of votes for the Front National

The Front National received a record number of votes in the second round of the regional elections

But the party still booked an all-time record result in this weekend’s second round, in terms of raw votes (see chart to the right, from here). 6.8 million votes went to the National Front’s candidates. That’s not just over 800,000 more than in the first round, but also more than voted for Marine Le Pen in the first round of the 2012 presidential elections. Which is all the more striking considering that there were 36.6 million votes in total in those, and just 26.5 million now. In the PACA region (Provence-Alpes-Côte d’Azur), for example, Marion Maréchal Le Pen  led the FN list and received a whopping 45% more votes in this second round than Marine Le Pen had gotten in her presidential bid.

So Le Pen is still very well-placed to improve significantly on her 2012 result, when she received 17.9% of the vote in the first round, in the next presidential elections.  A new opinion poll illustrates this.  If Sarkozy runs for the right, Le Pen would get 27% in the first round, with Sarkozy and incumbent President Hollande both getting 21%, centrist candidate Bayrou 12% and leftist candidate Mélenchon 10%. If, instead, the more moderate Alain Juppé runs for the right (in which case Bayrou would drop out), he would get 29% of the first round vote, Le Pen 27%, and Hollande 22%.

In practical terms, the FN tripled its number of councilors. (See the charts in the right column here for the share of councilors it won in each region.) Due to France’s electoral system, the FN has always had trouble building a good bench of local and regional politicians, and this will help it expand that bench significantly.

Libération, meanwhile, highlighted the ground the FN has won in terms of the political discourse. It pointed to the mainstream right’s winning candidate in the Rhône-Alpes-Auvergne region, Laurent Wauquiez, as example; he recently published a piece which proclaimed “Immigration, Hollande, Brussels: ça suffit” (“that’s enough”). Marion Maréchal Le Pen had already announced before the first round: “we have won the battle of ideas, not that of the parties”.

In her concession speech, Marine Le Pen gave a taste of what her presidential campaign will sound like. She argued that the withdrawal of the Socialist Party candidates in two crucial regions proved that the left-wing and right-wing parties are all the same, and triumphantly announced that there is now a new new kind of “bipartisme” – not between left and right, but between “patriots” and “mondialistes”.

Along similar lines, Marion Maréchal Le Pen denounced “the cynical profiteers” of the traditional parties, against which the Front National likes to contrast itself so much as clean alternative and authentic voice of the people. “Our love of France has never been as exalted,” she told her supporters. The Front National mayor of Hénin-Beaumont, Steeve Briois,  instead engaged in some projection, accusing “the republican front” of having “played on people’s fears and pursued a campaign of hate”.

Why the Front National failed to win any regions in the second round

Front National victories were prevented by a combination of three issues. One was that turnout increased significantly compared with the first round. As a result, the FN may have gained an additional 800,000 votes, but the other parties added a much higher number of 2,7 million voters to their tallies. It proved that there is still, for now, a “republican” majority for whom the FN is beyond the pale. A recent poll showed that 60% of the French think that the FN is “a dangerous party for democracy” and only 31% believes the FN is “capable of governing the country”.

The second reason the FN candidates fell short, surprisingly clearly in the case of Marine Le Pen herself in the Nord-Pas de Calais-Picardie (NPDCP) region, was that the Socialist Party withdrew its candidates in crucial regions. In the NPDCP and PACA regions, Marine and Marion Maréchal Le Pen had received over 40% of the vote in the first round, with the candidates for the traditional right-wing lists behind by over 14 points and the left’s candidates in third place. In both regions the left’s candidates retreated in order to block the Le Pens. In the northeastern region Alsace-Champagne-Ardenne-Lorraine, the Socialist Party withdrew its support from the Socialist candidate there who insisted on proceeding to the second round against its advice.

In Nord-Pas de Calais-Picardie, Socialist activists went as far as leafleting for the right-wing candidate to help stop Le Pen. While the Socialist withdrawals lead to “an explosion of blank votes” in those two regions, as some left-wingers went to the polls but refused to vote for either candidate, the mobilization of a “republican front” was nevertheless impressive. In the left-wing first ‘arrondissement’ of Marseille, for example, the left’s withdrawal and support boosted the traditional right-wing candidate’s results from 17,7% in the first round to 80,1% in the second round.
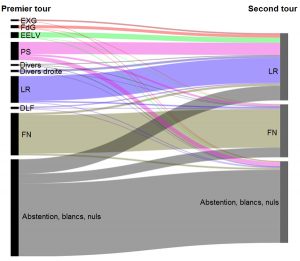
France regional elections: vote transfers

France regional elections: vote transfers between the first and second round in the two regions where the socialist candidate withdrew

The chart to the right, showing the pooled voter flows in the PACA and NPDCP regions, shows it nicely as well. The increase in turnout in the second round benefited both the traditional right and the far right, but the former more so than the latter. Most importantly, however, it looks like almost a third of the vote for the victorious traditional right’s candidates came from left-wing voters. The picture was much more straightforward in the other regions, which had three-way run-offs with left-wing, right-wing and far-right candidates, though again it’s noteworthy how the increased turnout benefited the former two much more than the FN.

The Socialists paid a heavy price for this exercise in civic spirit though. Nord-Pas de Calais had been one of the left’s traditional strongholds; the Socialists came first in every regional election there since the region was created in the mid-1980s. Now, the Socialist Party will not have any representatives in the regional assembly, nor in PACA.

Third, the FN leads in the first round were partly deceptive because of the role smaller parties played. The Socialist Party may have received just 23% of the vote in the first round, but various green and leftist candidates received an additional 13%, and those formed a natural reserve of additional second-round votes for Socialists who made the run-off. The traditional right could at least to some extent fall back on voters from the Gaullist, Eurosceptic “Arise France!”. But there are no smaller far-right parties of note which the FN can draw on in run-offs.

For example, the Socialist Party candidate in Bourgogne-Franche-Comté placed third in the first round, with 23% of the vote against 24% for the traditional right’s candidate and 31% for the FN candidate. But in that same first round, 12% voted for other left-wing candidates, who collectively put the left at 35%; and 8.5% of them voted for Arise France! and the center-right MoDem, which would put the traditional right at a total of 32.5%. There were no minor party candidates which provided a pool the FN candidate could draw from. From this perspective, the second round result was no surprise at all, since it almost exactly reflected the proportions of each “camp” (as wide-ranging and eclectic as those are) in the first round: 35% for the left’s candidate, 33% for the traditional right, and 32% for the FN.

The results and challenges for the left and (traditional) right

The end result, in which the left won five regions against seven regions for the right, was a better than expected result for the left. “At the beginning of the campaign,” the conservative Figaro wrote, the socialists “had hoped to hold three regions at most”. But Le Monde published a chart which emphasizes an important distinction: the regions the right won have twice as many inhabitants as the ones the left won. This is in no small measure due to the right winning “Île-de-France” (Greater Paris), which Libération called the country’s “mammoth region of 12 million inhabitants”. The loss of Île-de-France smarts all the more because the left had held it for the past sixteen years.

By ways of symbolic comfort, @Taniel pointed out, the Front National was very weak in the two Paris arrondissements where last month’s terrorist attacks occurred, getting just 5% of the vote there while the left romped home.
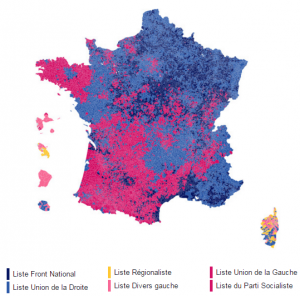
Map: results of the run-off, by commune

Regional elections in France: results of the run-off, by commune. Source: Le Monde.

The less-disastrous-than-expected result is still likely to reignite a long-standing fight within the Socialist Party. What should the strategy be, ahead of the next presidential elections? As Le Figaro wrote: “In a landscape where three political parties compete in the first round, with an advantage for the Front National, the crucial objective is to make it into the second round. But how? By achieving, foremost, unity on the left, or by trying to quickly search for voters in the centre? It’s this question the socialists will now struggle to answer, knowing that it divides them deeply.”

Sarkozy’s supporters on the right and center-right face similar, perhaps even more combustive internal arguments, however. Nathalie Kosciusko-Morizet, the vice-president of Sarkozy’s party who had already earlier openly dissented from his line, pointedly remarked last night that if the left had applied the same “neither-nor” line which Sarkozy imposed on the right, obliging its candidates to refrain from any kind of alliance with the left against the FN, the right “would have lost”. The right’s candidates in the PACA and NPDCP regions seemed well aware of this, making sure to thank the left’s voters. But Sarkozy’s line has strong allies too, like the above-mentioned Laurent Wauquiez. [Edit: One day after I wrote this post, Sarkozy had Kosciusko-Morizet fired and replaced by noone else but Wauquiez.]

What will complicate this fight is that there will likely be an additional argument over when the right’s presidential primaries should be held. If the right’s contenders, like Sarkozy and Juppé, are waging a bitter fight until shortly before the presidential elections themselves, this could harm them and create opportunities for a Left vs FN run-off. But aspiring contenders who are currently further back in the primary polls, like former PM François Fillon, want the extra time, Le Figaro explained. To add to the complications, Sarkozy seems like the front-runner, but the polls show Juppé doing much better in a run-off against Le Pen.

Education, income and partisan preference, France & Netherlands edition

A French polling outfit called OpinionWay did a survey for Le Point about who voted what in the second round of the regional elections, and the breakdowns by education and income are stark. They also happen to echo findings by Maurice de Hond’s polling outfit this weekend in the Netherlands.

Map: Run-off results by "département”

Another way of visualizing the run-off map: leading party/candidate by “département”. Source: Liberation

Breaking down results by three educational levels, OpinionWay found that a whopping 44% of lower-education voters voted for the Front National, while just 16% of higher-education voters did. Both the left and the traditional right did better among higher-education voters, and both — perhaps surprisingly — by roughly the same margins.

Among professional categories, workers (“ouvriers”) went for the Front National by a stunning 54% to 26% for the traditional right and just 20% (!) for the left. The unemployed, however, spread their votes evenly among the three camps. But another set of data from the survey shows that turnout among them was a bitterly low 36%.

The Front National also easily led among those with the lowest incomes (less than 1,000 euro/month), attracting 43% of them to 34% for the traditional right and just 23% for the left. The left came closest to leading among the upper middle income category of 2,000-3,500 Eu/m, getting 34% of their votes to 38% for the traditional right and 28% for the FN. The traditional right did best among the uppermost income category, getting 47% of its vote.

The Dutch poll had shown the far right with similar, dominant leads among lower-education voters. According to de Hond (also using three education-level categories), Geert Wilders and his Freedom Party are getting 37% of the lower-education vote, and just 14% of the higher-education vote. Almost half (46%) of lower-education voters would consider voting for the Freedom Party, vs just 20% of higher-education voters. The only other party whose support is slanted towards the lower-educated is on the opposite end of the political spectrum: the Socialist Party gets 13% of the lower-education and 7% of the higher-education vote. (“Would consider” voting for the Socialists: 28% vs 17%.)

Conversely, the liberal and conservative center-right parties (VVD, CDA and D66) are pooling a strong 48% of the vote among higher-education voters, but just 22% of the lower-education vote. It’s a serious cleavage, which has shown up in surveys in the Netherlands for years now, and seems much more pronounced than class-based cleavages in earlier decades. It’s a serious cleavage, which has shown up for years now, but seems so much more pronounced than class-based cleavages in earlier decades.

It’s also an arguably much more damaging cleavage. In the post-WW2 era, the Dutch working class disproportionally voted for the Labour Party (though the christian parties also always received a substantive chunk of the working class vote), and the Labour Party regularly got to govern, ensuring that working class interests would at least sometimes be met. As a result, working-class voters had some reason to retain an extent of confidence in the political system. However, neither the Freedom Party nor the Socialists in the Netherlands, nor the Front National in France, are likely to gain entry to government (and in the case of the far right parties wouldn’t do much constructive on behalf of working class voters even if they did). Meanwhile, the Dutch parties that are most amenable to coalition governments, like the VVD, CDA and D66 as well as the Labour Party, have less reason than ever to prioritize working class interests, since that’s not where their electorate lies (anymore). The political cleavage therefore threatens to lock working class voters in an anti-systemic camp, as that’s where the only parties are which appeal to their interests and sentiments, but those parties won’t be able to represent their interests in governmental policy and the other ones will have less reason to do so; all of which in turn will only erode any confidence working class voters have left in the system. It could be a real vicious cycle.

Comments Off on Regional elections in France and the National Front scare: After the run-off

Elections for “Supreme Burgomaster” in Dresden: Ready for round 2

European Politics, International Politics, Politics

Last weekend the citizens of Dresden went to the polls for the first round of elections for Oberbürgermeister, an office which Wikipedia translates as Supreme Burgomaster. That sounds funny. Let’s just say mayor.

The incumbent Helma Orosz, from Angela Merkel’s Christian-Democratic Union (CDU), had resigned in February – she suffers from breast cancer. The liberal FDP’s Dirk Hilbert took over her tasks for the few months since, and he ran in these elections as an independent candidate. His main opponent was (and remains) Eva-Maria Stange, a politician from the social-democratic SPD who is running as independent with the support of the SPD, Left Party and Greens. Hilbert’s bid was complicated by the CDU running its own candidate, and there were also two candidates from the populist (far) right. In comparison, Stange had little competition on the left – nobody but Lars Stosch, alias Lara Liqueur, from the satirical party The PARTY, who promised free beer and equal representation for lazy people.

Although Merkel’s CDU dominates the national party landscape, getting 41.5% of the vote in the 2013 parliamentary elections against the SPD’s 25.7%, Dresden was actually the last German city with over 400,000 inhabitants to still have a CDU mayor. But as capital city of the eastern state of Saxony it was a good place for it, since Saxony is a bit of a Christian-Democratic bulwark. The CDU actually used to get absolute majorities in state elections in the 1990s, and in last year’s state elections got 39% to the Left Party’s 19%.

Dresden itself has in the past been more politically balanced. In the municipal elections of 2014, the Left Party, Greens, SPD and Pirates pooled 52.7% of the vote (and yes, that was their ranking order), while the CDU and FDP pooled just 32.6% and the populist and far right (AfD and NPD) got almost 10%. But in the previous elections, in 2009, the left-of-center parties got just 44%, the CDU, FDP and DSU also pooled 44%, and the extreme right got 4%. Moreover, in the last mayoral elections – which took place all the way back in 2008 (seven-year terms!) – Helma Orosz almost got the 50% of the vote required to be elected in the first round, and eventually defeated the Left Party’s candidate by a massive 64% to 31% margin in the second round.

Orosz remained a popular mayor, but there was confusion on the right after she resigned. Her own party nominated Saxony’s Interior Minister Markus Ulbig, but he proved to be a weak candidate. Dresden was at the center of the mass rallies by the anti-Islam movement Pegida (as illogical as that might seem, considering that the city has very few muslim residents and just one mosque, and 80% of the population is secular), and Ulbig’s vacillating response managed to piss off both Pegida supporters and their left-wing opponents.

Instead, Hilbert became the center-right’s de facto main candidate. But on the far right, Pegida had its own candidate, the independent Tatjana Festerling, who likes to tell her supporters that the “professional politicians”, and especially those of the left, are just “alcoholics, communists and childfuckers,” and that a “flood” of asylum-seekers will increase crime. Festerling is too radical even for the upstart populist right-wing Alliance for Germany party (AfD), which sent its own candidate into the contest: Stefan Vogel.

The polls had foreseen a first round advantage for Stange, with Hilbert right behind and Ulbig merely in third place. That all turned out to be true, and with just 15% of the vote the CDU candidate was even further behind Stange (36%) and Hilbert (32%) than the polls has suggested. This means that, however the second round ends, the CDU will no longer have a mayor in any of Germany’s largest cities.

What the polls got all wrong was the far right’s appeal. Festerling did not merely get 1-3% of the vote, as they had indicated. She got 9.6%. And Vogel got another 4.8%.

Festerling did especially well in the city’s communist-era high-rise suburbs, like Gorbitz, which were partly torn down when they emptied out in the 1990s (Gorbitz itself used to have a population of well over 35,000; now it’s 21,000, though trending up again). Those neighbourhoods generally are a source of strength for the Left Party as well, but in this election the left/right divide mostly ran parallel to the divide between inner Dresden and the suburbs.

Saxony is an odd case in the sense that second round elections are not run-offs. They’re more of a re-run. Nobody gets eliminated after the first run; in principle, all the candidates are allowed to run again. (Baden-Wurtemberg has an even stranger system; there, even new candidates can still enter the race.) In practice though, it doesn’t work like that. Ulbig announced immediately after the first round that he would not stand in the second round and wanted to talk with Hilbert about an agreement. Perhaps more surprisingly, Festerling later withdrew as well and went further, quite stridently appealing to her supporters to vote for Hilbert. The state AfD joined in as well: the party’s primary aim should now be “to prevent a victory for the leftredgreen candidate and former SED member Stange”.

All of this suggests that Hilbert, rather than Stange, has the advantage going into the second round, which will take place on July 5. After all, when you add up the results for all the right-of-center parties, that’s 61.5% of the first round vote. No wonder that Stange has promised to “mobilize non-voters”. And that’s easier said than done too; in fact, the turnout in the first round was already unusually high, at 51% compared to the previous mayoral election’s 42%. Presumably that was thanks in large part to Festerling success in mobilizing protest voters who would normally not bother to show.

Yet things might not be quite as straightforward, as at least one local political scientist argues. Most of Festerling’s voters will probably stay home, he says. There’s certainly no organic link between Hilbert and Festerling’s voters: he did badly or very badly in many of the neighbourhoods she did best in. The supporters attending the rally where she made her endorsement certainly didn’t seem happy about it.

Moreover, Hilbert has so far done his best in his campaign to present himself as a moderate, almost neutral candidate who stands above party politics, and distances himself from both left and right. But now Ulbig and the CDU, and Festerling in her own way, are pushing him to wage more of a “Lagerwahlkampf” – an election campaign between two camps, left and right. How else is he going to rally their voters in a low-turnout election? But he doesn’t seem eager. He’s rejected the concept of a “Lagerwahlkampf” outright; refused to meet with Festerling, even as he also refused to repudiate her support; and surprised the CDU by ruling out a written pre-election agreement with any party.

Is he being smart, or shooting himself in the foot? Maybe Stange still stands a good chance after all.

Comments Off on Elections for “Supreme Burgomaster” in Dresden: Ready for round 2

Provincial elections in the Netherlands: The left is losing (its) face

European Politics, International Politics, Politics
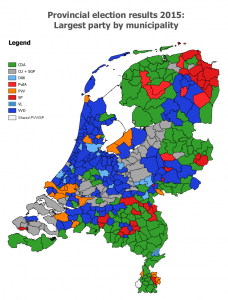
Election map, the Netherlands, provincial elections 2015

The Netherlands, provincial elections 2015: winning party by municipality

Unprecedented fragmentation, a weakened government that will have to go in search for further allies to keep functioning, and a new record low for the Labour Party. Those were the main features of the outcome of last month’s provincial elections, on March 18, which determined not just the make-up of provincial legislatures but also the Dutch Senate.

Because of the continuing collapse of the Labour Party, the results also constituted the worst performance for the left overall in provincial elections since 1994, while centrist parties — the Democrats ’66, a party for the elderly and various regional lists — did well.

I contributed a rather exhaustive analysis of the election results, with plenty of maps and charts, as guest post to the World Elections blog, and it’s also on Medium. Maybe see you there!

Comments Off on Provincial elections in the Netherlands: The left is losing (its) face

SNP voters who rejected Scottish independence? The results of yesterday’s referendum on Scottish independence pose a geographic paradox

European Politics, International Politics, Politics

The referendum on Scottish independence last night ended up as the No camp hoped, the Yes camp had been trying not to think about, and almost exactly as I’d predicted, though I was certainly not alone. The result is an anti-climax after such excitement and absolutely unprecedented turnout, and it leaves election obsessives picking through the results.

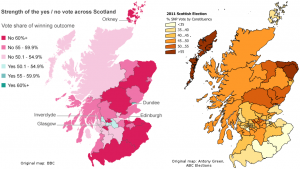
Here’s one thing that struck me: the Scottish National Party has become the major force in Scottish politics over the last decade or so, in Holyrood at least if not in Westminster. In the 2010 UK elections, the SNP received 19.9% of the Scottish vote, which was a good but hardly dominant result, but in the 2011 Scottish elections, the SNP won no fewer than 53 of the 73 single member constituencies, and 44.0% of the party vote – very close to the YES vote in the referendum (44.7%). The SNP was also, obviously, the major driver behind the referendum. So you’d expect a fairly close relation between the map of the 2011 SNP vote and the referendum vote. But nothing could be further from the truth.

I slightly adjusted the BBC map of the referendum results and the map of the SNP results in 2011 made by Antony Green for Australia’s ABC to make a direct comparison easier – with apologies to Shetland, which fell on the cutting room floor in the process. Click to enlarge:

Map: Scottish independence referendum vs SNP vote in 2011 Scottish elections

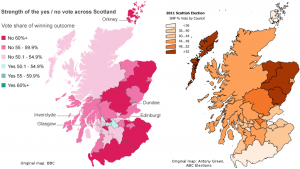
Ah, even better: Antony Green also made a map of the 2011 SNP vote by council area, which is the administrative unit by which the referendum results were announced. So that makes for a more direct comparison:

Map: Scottish independence referendum vs SNP vote in 2011 Scottish elections by council area

Keep in mind that dark on the referendum map means NO, whereas dark on the elections map means a high SNP vote – so you’d expect the dark (heavily SNP) regions on one map to match up with the light (low NO-vote) regions on the other map. But there’s no such relationship at all – North-East Scotland’s strong NO vote makes it almost looks like the opposite. If anything, due to the Glasgow-centered nature of the YES vote, there is more of an overlap with the map of the Labour Party’s 2011 results (even though Labour, of course, campaigned against independence).

Part of this is logical: Glasgow, the center of the YES campaign, where it succeeded in mobilizing an impressive number of mostly poor, disaffected people who normally don’t vote, is traditional Labour territory. All the more impressive that the pro-independence activists managed to get the city behind their cause.

But think about it: could the opposite then be true too? For example, the SNP won over 52% of the vote in the Moray, Aberdeenshire and Angus council areas in 2011. But yesterday only 42%, 40% and 44% respectively voted “Yes”, and these council areas made up a sizable 9% of the Scottish electorate. On the Western Isles, the SNP received over 52% of the 2011 vote, and Yes only 46.6%. In Perth & Kinross and Falkirk, the SNP received 48-52% of the vote in 2011, but Yes received just 47% of the vote in Falkirk, and a paltry 39.8% in Perth & Kinross. Especially when you consider that large numbers of Labour voters came out in favour of independence, as Glasgow shows, could this mean that a significant number of SNP voters came out against independence?

Not necessarily: after all, turnout was much lower in the Scottish elections – barely over 50%. For the referendum, it was a whopping 84.6%. So it could mean that in their own strongholds, the SNP voters were more alone than they must have felt: all those neighbours who normally don’t vote turned out to be heavily against independence. That would still make for a geographic anomaly though, because it would mean that the habitual non-voters who did come out to vote now were much more unionist-minded in SNP strongholds than their peers in other council areas. That’s possible, but not intuitive.

For what it’s worth, Lord Ashcroft’s overnight poll of 2,000 Scots found that 14% of those who voted for the SNP in the 2010 British elections voted NO yesterday. That’s 14% of the just 20% of Scottish voters who opted for the SNP in the Westminster elections. One might reasonably speculate that the share of NO voters among the much larger pool of those who voted for the SNP in 2011 was significantly larger still.

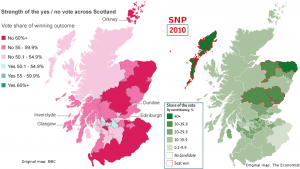
Comparing the geographical spread of the Yes vote in the referendum with the SNP result in the UK elections of 2010 is less relevant, considering the much smaller share of the vote the SNP received in those elections. But for the sake of being complete I’ve used a map made by The Economist for a side-by-side comparison on that one too:

Map: Scottish independence referendum vs SNP vote in 2010 UK elections

Completely off-topic, but Reddit turned up an interesting chart about the correlation between disposable income and the “No” vote by region. Not sure if it’s original content by the submitter or credit for the original creator was withheld; Google turns up no alternative sources of the image.

21 September: Helping to solve the mystery

Stephen Fisher did great work explaining what seemed like a paradox in this post at his blog Elections Etc. The TLDR is:

Only after controlling for the effects of socio-economic circumstances is there such a clear relationship between the Yes vote and SNP support. [S]ocio-economic factors seemed to be more important factors than prior nationalist support.

The reader comments by James in the comments section provide more helpful detail.

Comments Off on SNP voters who rejected Scottish independence? The results of yesterday’s referendum on Scottish independence pose a geographic paradox

Party preference and income levels in the districts of Budapest: Elections 2014

European Politics, International Politics, Politics

Despite its populist image, the governing Fidesz party is still very much a bourgeois party, at least in Budapest. Conversely, electoral support for the far-right Jobbik in Budapest tends to be stronger the poorer a neighbourhood is. On the other side of the political playing field, the five-party socialist/liberal opposition alliance had roughly equally strong (or weak) support in wealthier and poorer districts alike. But when those parties run separately, their support reveals very differing geographic patterns.

All of this is suggested by a series of scatter plots I created, which chart the results of Hungary’s general and European elections earlier this year in Budapest’s 23 districts against gross income per capita levels in those districts. Check out the Infogr.am embedded below the fold – although you might prefer to view it on the Infogr.am website itself, where the charts are square as they are supposed to be rather than rectangular – that’s just the format of this blog distorting them a little.

Two qualifications should be made beforehand, however:

  1. The electoral geography of Budapest, as it relates to income levels, does not necessarily follow the same logic as that of Hungary as a whole. For example, in the European elections at least, the Socialist Party (MSzP) did seem to do better in the poorer, working class districts of Budapest than in the more prosperous ones. But at the same time, the party’s results in Budapest as a whole were the best it received across the country, even though Budapest is also the most prosperous region of the country. The relation between Fidesz and Jobbik votes and income levels in Budapest also appear to be quite different from how they work out in some of the other regions.
  2. The fact that a party does best in the richest (or poorest) areas doesn’t necessarily mean it also does best among the richest (or poorest) voters. The United States is the classic example of this paradox: Democratic presidential candidates tend to do best in the most prosperous states (e.g. the Bos-Wash corridor and the West Coast) and worst in the poorest states (e.g. the Appalachians and the Deep South). But exit poll after exit poll has confirmed that, although the correlation is becoming weaker over time, the party does better among lower-income voters and worse among higher-income ones. However, since we’re dealing with data by city district rather than by whole states here, such a paradox should be less likely to occur.

(One more small-print disclaimer: for income data by district I’ve relied on the Hungarian Central Statistical Office’s data regarding “Gross income serving as basis of the personal income tax per permanent population”. But the comparison between districts works out a little differently if you use its numbers on “Gross income serving as basis of the personal income tax per tax-payer”. I decided not to do that because it doesn’t take the large and varying number of non-tax payers in a district into account, for example the unemployed – and what about pensioners? – and this makes some of the districts with the highest non-active rates, like the 8th, look better-off than they are. But choosing the indicator “per permanent population” has its own effects; if you’re surprised to see Újpest ranking higher on the income axis than Zugló, for example, this is why, because the district has a high percentage of employed, working-age population (whereas Zugló, I assume, has more pensioners). Districts 17, 19 (Kispest) and 21 (Csepel) would also rank noticably lower with the alternative indicator.)

Continue Reading »

Comments Off on Party preference and income levels in the districts of Budapest: Elections 2014

Last weekend’s elections in Brandenburg and Thüringen: some data

European Politics, International Politics, Politics

The populist right-wing Alliance for Germany (AfD) had a chance to repeat the success it enjoyed in state elections in Saxony two weeks ago in two state elections last Sunday, which both also took place in the former East-Germany. But in both Brandenburg and Thüringen, it went one better and got double-digit percentages. The AfD got 12% of the vote in Brandenburg (sometimes nicknamed “the small GDR”) and 10% in Thüringen.

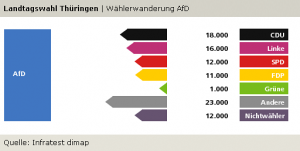
Just like in Saxony, the AfD took votes from across the political spectrum, pollster Infratest Dimap revealed. In Thüringen, just like in Saxony, the Christian-Democratic CDU, Social-Democratic SPD and (ex-communist) Left Party all saw 5-6% of their 2009 voters switch to the AfD, while the liberal FDP and extreme-right NPD lost significantly larger shares of their electorates to the party.

On the bright side, the SPD in Brandenburg easily maintained their position as the state’s top party, though the Left Party, which had been their junior government coalition partner, lost a lot and booked its worst state elections result there since 1990. Nevertheless, just like last time, Brandenburg’s SPD is free to choose to govern with them or with the CDU; either combination would have a majority.

In Thüringen, weirdly, the SPD has the same luxury of being able to pick its coalition partner, even though they lost heavily and were left with just 12% of the vote. Both the CDU and the Left Party did well, cementing their positions at the top of the state’s party system, and they both want to govern – but neither of them can do it without the Social-Democrats. So it will either be a renewed CDU/SPD government, with a parliamentary majority of 1, or a Left Party/SPD/Green government, also with a parliamentary majority of 1.

The latter would of course be more ground-breaking and exciting, but oddly enough the three parties actually pooled less of the state vote (46.3%) than five years ago (52.1%), and obviously back then the Social-Democrats chickened out, even though they were promised the Prime Ministerial post by the (larger) Left Party. However, their chickening out last time round, and their stubborn refusal to express a preference for one or the other coalition option in this year’s campaign, led to them losing a fair amount of votes to the Left Party in these elections. So maybe they won’t do it again.

I won’t do a fully-fledged blog post, but I tweeted some interesting data I’ll collate them here:

Voter flows

  • The Left Party in Brandenburg lost 19 thousand voters to the AfD, which attracted some attention; in part because of the curiosity of a stridently left-wing party losing voters to a populist right-wing party, and that not being an isolated phenomenon either, with far-left losing votes to far-right parties elsewhere as well; and in part because the AfD seemed to go out of its way to fish for Left Party votes. But to keep this in perspective: the Left Party also lost a whopping 119 thousand voters – six times as many – to the non-voter camp.
  • Vice versa, the CDU in Brandenburg had a good night, overtaking the Left as the state’s second-largest party for the first time since 1999, but nevertheless also lost 19 thousand votes to the AfD, meaning that the CDU lost a larger share of its 2009 voters to the AfD than the Left Party did.
  • The
    Wählerwanderung, AfD: Thüringen

    Voter transfers to the AfD in Thüringen

    AfD in Thuringen also pulled votes from across the political spectrum, as this chart shows. (The “Andere” category here includes 10,000 votes the AfD pulled from the NPD.)
  • What these numbers mean is that the CDU lost 7% of its 2009 vote in Brandenburg, and 5% of its 2009 vote in Thüringen to the AfD; the Left Party lost 5% and 6%, respectively, of its 2009 vote in the two states to the AfD; and the FDP lost 14% and 12% of its vote, respectively, to the AfD. The SPD lost 6% of its 2009 vote in Thüringen to the AfD, but just 3% of its vote in Brandenburg.

Demographics:

  • More data on who voted for whom: In both Thüringen and Brandenburg, the AfD’s best professional groups were workers and the self-employed. And in both states, the Left Party did best among the unemployed and pensioners.
  • Here’s a worrying data point: for both the SPD and the Left Party, in both Brandenburg and Thüringen, the best age group was those over 60+. The fact that it’s true for both parties makes it all the more worrying about their long-term future in these East-German states. Meanwhile, the best age group for the AfD in both states was those between 25 and 34.

History:

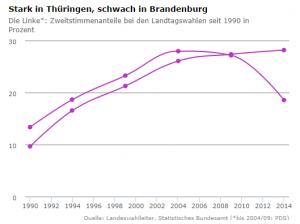
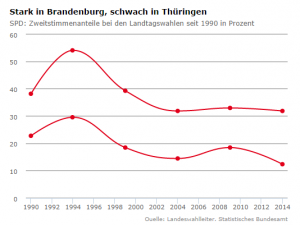
  • A historical perspective: the Left Party booked its best ever result in Thüringen … and its worst result since 1990 in Brandenburg. The SPD booked its worst result in the postcommunist era in Thüringen, and ex aequo (with 2004) the worst in Brandenburg. The Greens got their best result in Brandenburg since 1990, and the FDP its worst result there ever. Surprisingly, the FDP in Thüringen has seen worse times still (1.1% in 1999). The Spiegel has a couple of interactive charts to explore some of those historical trajectories, and here are screenshots for two of them:
  • Strong in Thüringen, weak in Brandenburg - Left Party state election results since 1990

    Strong in Thüringen, weak in Brandenburg - Left Party state election results since 1990

    Strong in Brandenburg, weak in Thüringen - SPD state election results since 1990

    Strong in Brandenburg, weak in Thüringen - SPD state election results since 1990

Comments Off on Last weekend’s elections in Brandenburg and Thüringen: some data

Charts! Last weekend’s elections in Saxony: Dresden, Leipzig and Chemnitz vs. the rest of the state

European Politics, International Politics, Politics

Last Sunday’s state elections in Saxony were marked by a low turnout, an only slightly eroded dominant position of the Christian-Democrats, and an imposing result for the right-wing, anti-system Alliance for Germany (AfD) party. The AfD was helped by the fact that these elections, the first state elections it ever took part in, took place in the very state where the party had already done best in the federal and European elections. Nevertheless, its 9.7% of the vote was remarkable and well beyond what the polls had foreseen.

Election night had its share of suspense as the extreme-right NPD hovered right around the 5% electoral threshold. It ended up missing it by a hair and getting 4.95%, which means it’ll be cast out of state parliament after ten years in its stronghold state.

There are several interesting geographic dimensions to the results, and I created an infographic at Infogr.am to share them. Below the fold, I accompany the Infogr.am charts with a few observations about what they show.

Continue Reading »

Comments Off on Charts! Last weekend’s elections in Saxony: Dresden, Leipzig and Chemnitz vs. the rest of the state

Of sideshows, curiosities and structural changes: Everything you ever wanted to know about this year’s local elections in the Netherlands (and probably quite a bit more)

European Politics, International Politics, Politics

Update: see also this post about the provincial elections of 2015 in the Netherlands – it has better maps and dives into some electoral history as well.

It’s not easy for local elections in a country the size of The Netherlands to make the international news. But if there’s anyone who can make it happen, it’s the peroxide-blonde leader of the Dutch far right Freedom Party, Geert Wilders. And that’s what he did, on March 19, when the municipal election results were being tallied.

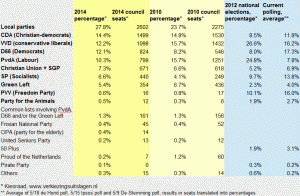
2014 Municipal election results, the Netherlands

Click to enlarge: 2014 municipal election results

Orating to a Freedom Party rally in The Hague, Wilders asked his supporters to give “a clear answer” to three questions that he was going to ask them; three questions that “defined our party”. “Do you want more or less European Union?”, he started off. Less, less, his supporters chanted enthusiastically. Second question: “Do you want more or less Labour Party?” Again, the crowd clapped and chanted: “less, less!”. So Wilders moved on to the third question. “I’m really not allowed to say this,” he started, but “freedom of expression is a great value … so I ask you, do you want more or fewer Moroccans, in this city and in the Netherlands?” The crowd, elated, chanted back: “Fewer, fewer, fewer!”, and with a sly little smile Wilders remarked, “then we’ll go and arrange that”.

Which got the Dutch election night headline space from the BBC to The Guardian, from the Times of Israel to Al-Jazeera, and from Fox News to the Huffington Post.

All of which was pretty unfair, considering that Wilders’ Freedom Party (or the PVV, as the Dutch call it) had been something of a non-entity in the whole local elections campaign. The party had refrained from taking part in the elections altogether in all but two municipalities: The Hague, the seat of the Dutch government, and Almere, a large town in Amsterdam’s commuter belt. Moreover, as was mentioned in almost none of these stories, it actually lost votes in both cities.

Continue Reading »

4 Comments

The geographical (and historical?) divisions underlying Ukraine’s political strife

European Politics, History, International Politics, Politics

As Washington Post blogger Max Fischer illustrated with what he called “the one map you need to understand Ukraine’s crisis”, the current protests and revolts in Ukraine are fierce, but largely limited to the north and west of the country, which is right in line with the pattern revealed in the 2010 election outcomes. It’s no secret that the same broad geographic divide appeared, time and again, in most of the elections since 1991, when Ukraine gained independence.

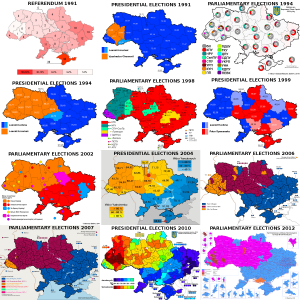
Ukrainian election maps, 1991-2012

Ukraine: Election maps for all the main elections since 1991

For convenience’s sake, I gathered electoral maps for all the presidential and parliamentary elections in those twenty years (as well as the 1991 independence referendum), in one big overview file. All of those maps are from Wikimedia/Wikipedia.

(One contestable editorial decision I made for the 2012 parliamentary elections was in choosing the map that showed the leaders in multi-member districts by constituency, rather than the one showing the leaders in single-mandate constituencies, which includes a lot of independents and is therefore less clear. I also couldn’t find a map of the results for Gorbachev’s All-Union referendum in 1991.)

Oddly, the candidates actually running for presidential office sometimes seemed irrelevant to the geographic divide itself. In 1991, the former dissident Viacheslav Chornovil was the worthy but politically weak candidate who won only in the Galician northwest of the country, while former apparatchik Leonid Kravchuk based his landslide victory on wide support in the south and east. But in 1995, the roles were reversed: Kravchuk won constituencies across the north and west when he lost his reelection bid against Leonid Kuchma, who swept the vote in the south and east. Those elections marked the first real time that the electoral map showed a dividing line right down the middle of the country that would start marking election maps again in every major election after 2002. But it gets stranger still: move on to 1999, when Kuchma faced a Communist Party candidate as opponent in his reelection bid — and it was Kuchma who won almost all of the north and west, while support for the communist candidate was based mostly in the south and east.

Considering Chornovil’s, Kravchuk’s and Tymoshenko’s losses, and the gritted teeth with which many voters in Kiev and the northeast must have voted for Kravchuk in ’94 and Kuchma in ’99, it’s hard to elide the thought that this pattern illustrates how the real political power in the country has lain in the south/east. The voters in the north/west have had to choose between voting for the lesser evil or rebelling in the streets. Yushchenko’s victory would be the only exception, and that took a revolution. I doubt that Viktor Yanukovich will ever switch to being the northwest’s candidate, though …

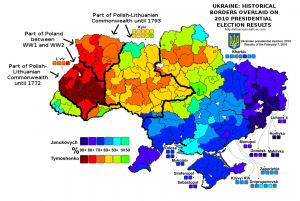
There is one further geographic wrinkle of note in these maps, and that is how the Transcarpathian/Ruthenian region constitutes a bit of an outlier within the northwestern half of the country. That’s the region midway on the left side, where the country’s borders take a turn east to curve around Romania, which is often coloured differently from all the surrounding territories. It can’t be a coincidence that the historical background of that region is wholly separate. Whereas the rest of northwestern Ukraine used to belong to the Polish-Lithuanian Commonwealth, and much of it to interbellum Poland as well, this region belonged to the Austro-Hungarian empire until WW1, and to Czechoslovakia between the two world wars.

When it comes to elections, history can be destiny. A map overlaying the borders between Imperial Russia and Imperial Germany on the Polish election results of 2007 has done the rounds online among map geeks for a few years because of the striking correspondence it reveals. And on a Reddit thread about these Ukrainian election maps, commenter Martin Keegan pointed out that “the boundary is where the old Polish-Lithuanian – Russian border used to be,” an idea he previously proposed on his blog. That piqued my curiosity, so I ventured on an effort to do a similar overlay to the Polish one: how do the old Polish and Lithuanian borders with Russia overlap with Ukraine’s current political polarization?

It was more of an effort than I’d have thought. But here is the result, overlaying different historical borders on the 2010 Presidential election results. It turns out that Keegan wasn’t entirely correct about the old Polish-Lithuanian – Russian border – but he definitely had a good point about the continuing salience of historical borders. Check out how the territory that still belonged to Poland in between the two world wars overlaps with the most overwhelming support for Tymoshenko (click the map to enlarge).


Historical borders and the 2010 Ukrainian election map

History as destiny? Historical borders superimposed on the 2010 Ukrainian election map

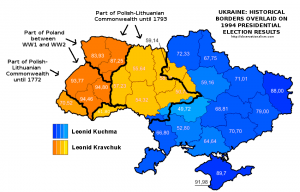
Moreover, Keegan’s point appears more vindicated when looking at the 1991 referendum results, though the division there was merely one between a large versus a near-unanimous majority in favour of idependence, or, especially, the 1994 presidential elections. Here is what the historical overlay looks like for the latter:


Historical borders and the 1994 Ukrainian election map

History as destiny, Pt. II? Historical borders superimposed on the 1994 Ukrainian election map


There are, however, also ways in which history is conspicuously not destiny. Or at least not in ways that are immediately obvious or make sense intuitively. Check out this map of the Holodomor – the genocidal, man-made famine that struck large parts of Ukraine, which is often blamed on indifference or outright malice on the part of Stalin and his regime. Compare it with the post-independence electoral maps, and any overlap is … hard to see. If anything, the Holodomor was most devastating in areas that now habitually side with Russia-friendly politicians like Yanukovich. Which doesn’t immediately make instinctive sense.

Methodological note:

The historical borders are approximate, though I did my best to be precise. As source material I used a map of Northeastern Europe around 1700; a Wikimedia map of the Polish-Lithuanian Commonwealth anno 1789; a Wikimedia map of Poland after the Second Partition of 1793; the detailed 1794 Laurie and Whittle map of the Kingdom of Poland; and an administrative map of Interbellum Poland in 1930. In addition, I used the Wikipedia page and subpages on the administrative raions of Ukraine,  and a detailed Ukrainian Wikimedia map of the electoral multimandate raions of the country. Delineating the far eastern border of the Polish-Lithuanian Commonwealth was a bit difficult since some settlements like the erstwhile Krylov that were right on the border back then have long been submerged in the Kremenchuk dam reservoir. In the south, the problem in defining how the historical border overlaps with current territories, lacking more detailed maps, lies with the transfer of Transnistria to Moldova.

3 Comments

Money raised versus result achieved: The Senate ’08 sweepstakes

Congressional Elections, Politics, US Elections, US Politics
Excel sheet: US Senate candidates 2008 - results and efficiency of financial investment

Excel sheet: US Senate candidates 2008 - results and efficiency of financial investment

Chris Bowers last week linked through to a site I hadn’t seen yet, noting that The Green Papers has the final popular vote and fundraising totals for all 2008 U.S. House of Representatives election campaigns. They cover all candidates too, not just those of the main two parties.

Bowers does a good job analysing the numbers, and above all, brings the good news:

The final popular vote percentages were 53.08%-42.55%, giving Democrats a 10.53% victory. This is the largest popular vote percentage victory for either party in either a Presidential or Congressional election since 1984 (the next largest victory was Bill Clinton with 8.51% in 1996). It is the first double-digit victory for any party in a national election in 24 years. That, truly, is a historical butt-whooping.

Turns out the Green Papers site has the same data for the Senate races. Fascinating stuff for political geeks. What caught my attention in particular is how the money the candidates raised compared to the votes they got. In short: how did their investments pay off?

So what I’ve done, in turn, is add a couple of columns to the data table, to calculate how much the candidates raised for every single vote they received, and for every single percentage point they won. The file is up at Google Docs. (It would arguably have been better to use the data for how much money they actually spent, but that would involve making a similar effort to The Green Papers’ and gathering the data for 2-4 candidates in each of 50 races from the FEC site onself).

Time then, to declare some winners!

Most expensive Senate race of 2008

As you’ll have guessed, that was the Minnesota race between Al Franken and Norm Coleman. The two men raised $20.5 million and $18.0 million, respectively. That translates to $488 thousand and $430 thousand for each percentage point of the vote they ended up winning – which ranks Al and Norm as #1 and 2 when it comes to raising the most money per percentage point won.

Don’t forget that Minnesota’s a fairly populous state, though. When it comes to how much money they had to raise for each individual vote they won, they rank a more modest #10 and 11. Meaning that they had to raise “only” – ponder this for a second – $17 and $15 for every single vote they won.

Most money spent on each individual vote

You’d think that states with small populations would also cost less to campaign in. This is true – up to a point, apparently. The top of this list is filled with candidates from “small” states, who made Franken and Coleman look practically callous about the individual voter’s worth.

Your vote was worth most up in Alaska. Mark Begich raised a total of $4.4 million – which translates to a royal $29 for every single vote he received. His opponent, Ted “bring home the pork” Stevens, was right up there too and raised a stunning $26 per vote – in vain.

Max Baucus from Montana and the two contenders in the New Hampshire race, John Sununu and Jeanne Shaheen, also ended up raising at least $23 per vote.

Continue Reading »

14 Comments

More exit poll comparisons, 2000-2004-2008

Politics, Presidential Elections, US Elections, US Politics

Continuing on the previous post, which covered basic demographic categories of gender, race, age, income, education and party ID, here are several other side-by-side comparisons between the exit poll data on the 2000, 2004 and 2008 presidential elections.

Among which groups has Obama done better or worse, and by how much, than Kerry and Gore did? A look at first-time voters, religious groups, married versus unmarried voters, union households and gun-owning households, urban, suburban and rural voters, and voters from the different regions of the country.

When looking at these charts, keep the overall, national data in mind. Gore got 48.4% of the vote, Kerry 48.3% and Obama 52.6% – so that’s the standard. If Obama gained 5% or more in a demographic group compared to Kerry and Gore, it means he made bigger advances in this group than on average; if he gained 3% or less, it means he “underperformed” in comparison with other demographic groups.

FIRST TIME VOTERS

Share of voters: 9% in 2000; 11% in 2004; 11% in 2008.

Yes, that’s one huge blue victory in 2008 – the contrast with previous cycles, in which the Democratic candidate already had the advantage, is enormous. It’s an advance that dwarfs all others in this overview.

PROTESTANTS

Share of voters: 54% in 2000; 54% in 2004; 54% in 2008.

Note that the increased turnout that Obama inspired among African-Americans (and, presumably, a corresponding decreased turnout among the white evangelical vote Bush mobilised so successfully in 2004) should have helped amplify Obama’s gains among Protestants.

Continue Reading »

13 Comments
« Older Posts