Browsing the archives for the regions tag.

Provincial elections in the Netherlands: The left is losing (its) face

European Politics, International Politics, Politics
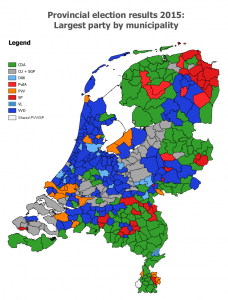
Election map, the Netherlands, provincial elections 2015

The Netherlands, provincial elections 2015: winning party by municipality

Unprecedented fragmentation, a weakened government that will have to go in search for further allies to keep functioning, and a new record low for the Labour Party. Those were the main features of the outcome of last month’s provincial elections, on March 18, which determined not just the make-up of provincial legislatures but also the Dutch Senate.

Because of the continuing collapse of the Labour Party, the results also constituted the worst performance for the left overall in provincial elections since 1994, while centrist parties — the Democrats ’66, a party for the elderly and various regional lists — did well.

I contributed a rather exhaustive analysis of the election results, with plenty of maps and charts, as guest post to the World Elections blog, and it’s also on Medium. Maybe see you there!
Comments Off on Provincial elections in the Netherlands: The left is losing (its) face

More exit poll comparisons, 2000-2004-2008

Politics, Presidential Elections, US Elections, US Politics

Continuing on the previous post, which covered basic demographic categories of gender, race, age, income, education and party ID, here are several other side-by-side comparisons between the exit poll data on the 2000, 2004 and 2008 presidential elections.

Among which groups has Obama done better or worse, and by how much, than Kerry and Gore did? A look at first-time voters, religious groups, married versus unmarried voters, union households and gun-owning households, urban, suburban and rural voters, and voters from the different regions of the country.

When looking at these charts, keep the overall, national data in mind. Gore got 48.4% of the vote, Kerry 48.3% and Obama 52.6% – so that’s the standard. If Obama gained 5% or more in a demographic group compared to Kerry and Gore, it means he made bigger advances in this group than on average; if he gained 3% or less, it means he “underperformed” in comparison with other demographic groups.

FIRST TIME VOTERS

Share of voters: 9% in 2000; 11% in 2004; 11% in 2008.

Yes, that’s one huge blue victory in 2008 – the contrast with previous cycles, in which the Democratic candidate already had the advantage, is enormous. It’s an advance that dwarfs all others in this overview.

PROTESTANTS

Share of voters: 54% in 2000; 54% in 2004; 54% in 2008.

Note that the increased turnout that Obama inspired among African-Americans (and, presumably, a corresponding decreased turnout among the white evangelical vote Bush mobilised so successfully in 2004) should have helped amplify Obama’s gains among Protestants.

Continue Reading »

13 Comments