Browsing the archives for the income tag.

Party preference and income levels in the districts of Budapest: Elections 2014

European Politics, International Politics, Politics

Despite its populist image, the governing Fidesz party is still very much a bourgeois party, at least in Budapest. Conversely, electoral support for the far-right Jobbik in Budapest tends to be stronger the poorer a neighbourhood is. On the other side of the political playing field, the five-party socialist/liberal opposition alliance had roughly equally strong (or weak) support in wealthier and poorer districts alike. But when those parties run separately, their support reveals very differing geographic patterns.

All of this is suggested by a series of scatter plots I created, which chart the results of Hungary’s general and European elections earlier this year in Budapest’s 23 districts against gross income per capita levels in those districts. Check out the Infogr.am embedded below the fold – although you might prefer to view it on the Infogr.am website itself, where the charts are square as they are supposed to be rather than rectangular – that’s just the format of this blog distorting them a little.

Two qualifications should be made beforehand, however:

  1. The electoral geography of Budapest, as it relates to income levels, does not necessarily follow the same logic as that of Hungary as a whole. For example, in the European elections at least, the Socialist Party (MSzP) did seem to do better in the poorer, working class districts of Budapest than in the more prosperous ones. But at the same time, the party’s results in Budapest as a whole were the best it received across the country, even though Budapest is also the most prosperous region of the country. The relation between Fidesz and Jobbik votes and income levels in Budapest also appear to be quite different from how they work out in some of the other regions.
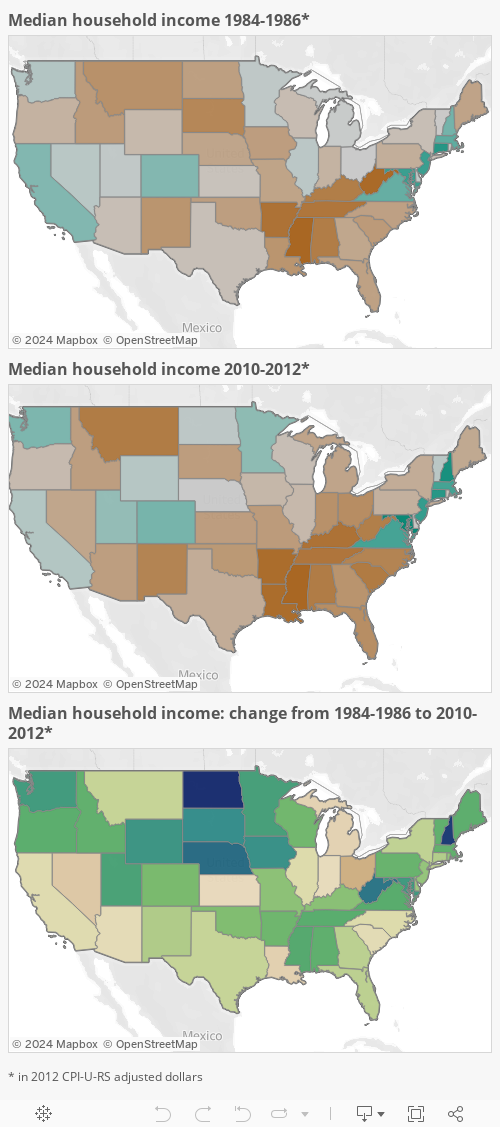
  2. The fact that a party does best in the richest (or poorest) areas doesn’t necessarily mean it also does best among the richest (or poorest) voters. The United States is the classic example of this paradox: Democratic presidential candidates tend to do best in the most prosperous states (e.g. the Bos-Wash corridor and the West Coast) and worst in the poorest states (e.g. the Appalachians and the Deep South). But exit poll after exit poll has confirmed that, although the correlation is becoming weaker over time, the party does better among lower-income voters and worse among higher-income ones. However, since we’re dealing with data by city district rather than by whole states here, such a paradox should be less likely to occur.

(One more small-print disclaimer: for income data by district I’ve relied on the Hungarian Central Statistical Office’s data regarding “Gross income serving as basis of the personal income tax per permanent population”. But the comparison between districts works out a little differently if you use its numbers on “Gross income serving as basis of the personal income tax per tax-payer”. I decided not to do that because it doesn’t take the large and varying number of non-tax payers in a district into account, for example the unemployed – and what about pensioners? – and this makes some of the districts with the highest non-active rates, like the 8th, look better-off than they are. But choosing the indicator “per permanent population” has its own effects; if you’re surprised to see Újpest ranking higher on the income axis than Zugló, for example, this is why, because the district has a high percentage of employed, working-age population (whereas Zugló, I assume, has more pensioners). Districts 17, 19 (Kispest) and 21 (Csepel) would also rank noticably lower with the alternative indicator.)

Continue Reading »

Comments Off on Party preference and income levels in the districts of Budapest: Elections 2014

A weak tide, that’s not lifting all boats: median household income in the Unites States then and now

Economy, Uncategorized, US Economy

From 1984-1986 up through 2010-2012, the US Census Bureau maintained three-year average data on median household incomes by state, as part of its Annual Social and Economic Supplement. To see how even, or uneven, the growth in that median income has been from state to state, I decided to take that first and last data point and compare the changes. Which states progressed the most – and which the least?

The result is this chart ‒ you’ll need click to enlarge, otherwise you won’t see much (and here is the data as PDF). Size of the bubbles represents 2010 population size.

Chart: Median household income by state, in 1984-1986 and 2010-2012

Click to enlarge: Median household income by state then and now

My interest in this data related primarily to the discussions about stagnating middle class wages in the US; over the years I’ve seen the subject come up time and again that especially male, middle or working class individuals, and most especially those working in manufacturing, are hardly or no better off now than they were in the mid- or late 1970s. This US Census Bureau data set about median household incomes doesn’t quite confirm that, but the national growth it does show, in inflation-adjusted dollars, between 1984-1986 and 2010-2012 is hardly impressive: an anemic 6.2% in 26 years. In addition it should probably be kept in mind that the data set only starts out after the depression of the early 1980s and some 5 years of Ronald Reagan’s administration, which coincided with a rapid increase in income inequality.

The list of the states with the lowest median household income in 2010-2012 was not surprising: starting at the bottom, it’s Mississippi, Arkansas, Louisiana, Kentucky, Tennessee and South Carolina. Montana has the lowest median household income outside the South, whereas West Virginia, perhaps surprisingly, is only the ninth-poorest state by this measure.

The comparison with the ranking and proportions 26 years earlier yields some surprises. In no fewer than six states, the median household income was higher then, than it is now. In an additional five states, the median household income in 2010-12 is at most $1000 higher (in 2012 CPI-U-RS adjusted dollars). These near-dozen states include:

  • Three midwestern states with lots of (former) industry, as you’d expect: Ohio, Michigan and Indiana. Ohio suffered the deepest cuts of the Lower 48, with a median household income that was 7.9% lower in 2010-12 than in 1984-86. Michigan, too, ended up with an actual decrease in median household incomes.
  • Three states in the southwest: California, Nevada and Arizona. Maybe the influx of Latino immigrants, many of whom now survive on low wages, is dragging the median down? Nevada now has a lower median household income than in the mid-80s.
  • Two states in the Deep South (Louisiana and South Carolina); as well as Kansas, Alaska, and Hawaii. Alaska was down the most of all states, actually, though even now it still ranks in the top 10.

The states where median wages in 2010-12 were at least $8,000 higher than 26 years earlier include:

  • In the BosWash corridor, New Hampshire and Maryland. Those two states have ended up with the highest median wages of the country (booming exurbs?). But the largest growth of all the U.S., at +$15,714 and +35.1%, was in Washington DC, which has transformed unrecognizably since Marion Barry’s glory days and the crack epidemic.
  • North Dakota ‒ location of a remarkable oil boom ‒ has seen the nation’s second largest growth in median household income: +$12,385 or +28.6%. Nearby Wyoming also benefits from its flourishing extractive industries, as well as the growth in tourism. (In comparison, it’s striking that Alaska’s median income is down by so much, considering that it’s another state whose economy is disproportionally dependent on oil, gas and mining.)
  • Elsewhere in the Upper Midwest, however, South Dakota, Nebraska and Iowa also all saw well above-average growth in median household incomes. I’m grasping for explanations here, but maybe that has involved the tail end of the long process in which small family farms died out (and the farmers’ sons and daughters moved to the city) and were replaced by large-scale, prosperous agro-industrial farms?
  • Washington state (Microsoft, Boeing, Amazon and/or Starbucks?) … as well as West-Virginia. Which surprised me. West-Virginia had the second-lowest median wages of the nation in ’84-86, ahead of only Mississippi; now it has the ninth-lowest, higher than states like Montana and Tennessee.

The above visualization is the result of generating a bubble chart within Google Spreadsheets, and then processing it in GIMP to add the diagonal line and labels, as well as to pull apart the labels for individual states where the Google chart had superimposed them over each other.

For an automatically generated alternative, I also tried using TableauPublic, and the resulting chart looks a lot more sleek: Median Household Income by State, 1984-196 vs. 2010-2012. It lacks explanatory labeling and a diagonal line to help you orient yourself though. The program is free, but if you’re using it for the first time it takes a bit of figuring out ‒ you’re really going to need the instructions. Once you get a grasp on the basics, though, a chart like this is extremely easy to create.

I found maps a little more complicated to make in TableauPublic, especially compared with using the “geomap” option when creating charts in Google Spreadsheets. But since the Google Geomap won’t show on this blog, I did it anyway. Here are the maps showing the data on median household income by state in 1984-1986, in 2010-2012, and the difference between those two years. I’m afraid Alaska and Hawaii got cut off (another reason to prefer Google Spreadsheets’ geomap, where they are neatly scaled and repositioned to fit into a simple U.S. view), though you should still be able to use the zoom functions to reveal them.

Comparing the maps, it seems to me that the contrast between the BosWash corridor and the surrounding country has grown only more pronounced. You can clearly see the relative decline of the industrial Midwest. The South remains the worst off, as the TableauPublic bubble chart illustrates well too, though the poorest Southern states are also the ones that have caught up with the others the most – with states like Alabama, Tennessee and West-Virginia catching up with the Carolinas and Louisiana. The West remains a bit of a patchwork, meanwhile, with Colorado, Utah and Wyoming, blessed with higher median household incomes, putting some distance between themselves and Montana, Nevada, Arizona and New Mexico.

Comments Off on A weak tide, that’s not lifting all boats: median household income in the Unites States then and now