Browsing the archives for the referendum tag.

SNP voters who rejected Scottish independence? The results of yesterday’s referendum on Scottish independence pose a geographic paradox

European Politics, International Politics, Politics

The referendum on Scottish independence last night ended up as the No camp hoped, the Yes camp had been trying not to think about, and almost exactly as I’d predicted, though I was certainly not alone. The result is an anti-climax after such excitement and absolutely unprecedented turnout, and it leaves election obsessives picking through the results.

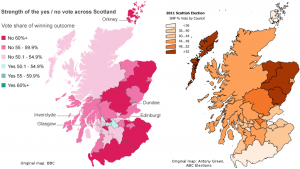
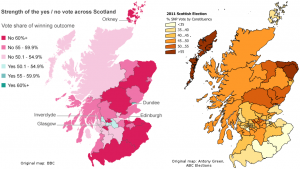
Here’s one thing that struck me: the Scottish National Party has become the major force in Scottish politics over the last decade or so, in Holyrood at least if not in Westminster. In the 2010 UK elections, the SNP received 19.9% of the Scottish vote, which was a good but hardly dominant result, but in the 2011 Scottish elections, the SNP won no fewer than 53 of the 73 single member constituencies, and 44.0% of the party vote – very close to the YES vote in the referendum (44.7%). The SNP was also, obviously, the major driver behind the referendum. So you’d expect a fairly close relation between the map of the 2011 SNP vote and the referendum vote. But nothing could be further from the truth.

I slightly adjusted the BBC map of the referendum results and the map of the SNP results in 2011 made by Antony Green for Australia’s ABC to make a direct comparison easier – with apologies to Shetland, which fell on the cutting room floor in the process. Click to enlarge:

Map: Scottish independence referendum vs SNP vote in 2011 Scottish elections

Ah, even better: Antony Green also made a map of the 2011 SNP vote by council area, which is the administrative unit by which the referendum results were announced. So that makes for a more direct comparison:

Map: Scottish independence referendum vs SNP vote in 2011 Scottish elections by council area

Keep in mind that dark on the referendum map means NO, whereas dark on the elections map means a high SNP vote – so you’d expect the dark (heavily SNP) regions on one map to match up with the light (low NO-vote) regions on the other map. But there’s no such relationship at all – North-East Scotland’s strong NO vote makes it almost looks like the opposite. If anything, due to the Glasgow-centered nature of the YES vote, there is more of an overlap with the map of the Labour Party’s 2011 results (even though Labour, of course, campaigned against independence).

Part of this is logical: Glasgow, the center of the YES campaign, where it succeeded in mobilizing an impressive number of mostly poor, disaffected people who normally don’t vote, is traditional Labour territory. All the more impressive that the pro-independence activists managed to get the city behind their cause.

But think about it: could the opposite then be true too? For example, the SNP won over 52% of the vote in the Moray, Aberdeenshire and Angus council areas in 2011. But yesterday only 42%, 40% and 44% respectively voted “Yes”, and these council areas made up a sizable 9% of the Scottish electorate. On the Western Isles, the SNP received over 52% of the 2011 vote, and Yes only 46.6%. In Perth & Kinross and Falkirk, the SNP received 48-52% of the vote in 2011, but Yes received just 47% of the vote in Falkirk, and a paltry 39.8% in Perth & Kinross. Especially when you consider that large numbers of Labour voters came out in favour of independence, as Glasgow shows, could this mean that a significant number of SNP voters came out against independence?

Not necessarily: after all, turnout was much lower in the Scottish elections – barely over 50%. For the referendum, it was a whopping 84.6%. So it could mean that in their own strongholds, the SNP voters were more alone than they must have felt: all those neighbours who normally don’t vote turned out to be heavily against independence. That would still make for a geographic anomaly though, because it would mean that the habitual non-voters who did come out to vote now were much more unionist-minded in SNP strongholds than their peers in other council areas. That’s possible, but not intuitive.

For what it’s worth, Lord Ashcroft’s overnight poll of 2,000 Scots found that 14% of those who voted for the SNP in the 2010 British elections voted NO yesterday. That’s 14% of the just 20% of Scottish voters who opted for the SNP in the Westminster elections. One might reasonably speculate that the share of NO voters among the much larger pool of those who voted for the SNP in 2011 was significantly larger still.

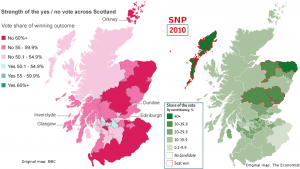
Comparing the geographical spread of the Yes vote in the referendum with the SNP result in the UK elections of 2010 is less relevant, considering the much smaller share of the vote the SNP received in those elections. But for the sake of being complete I’ve used a map made by The Economist for a side-by-side comparison on that one too:

Map: Scottish independence referendum vs SNP vote in 2010 UK elections

Completely off-topic, but Reddit turned up an interesting chart about the correlation between disposable income and the “No” vote by region. Not sure if it’s original content by the submitter or credit for the original creator was withheld; Google turns up no alternative sources of the image.

21 September: Helping to solve the mystery

Stephen Fisher did great work explaining what seemed like a paradox in this post at his blog Elections Etc. The TLDR is:

Only after controlling for the effects of socio-economic circumstances is there such a clear relationship between the Yes vote and SNP support. [S]ocio-economic factors seemed to be more important factors than prior nationalist support.

The reader comments by James in the comments section provide more helpful detail.
Comments Off on SNP voters who rejected Scottish independence? The results of yesterday’s referendum on Scottish independence pose a geographic paradox

Failure or success for the regime? The constitutional referendum results in comparison and the political geography of Egypt

International Politics, Politics
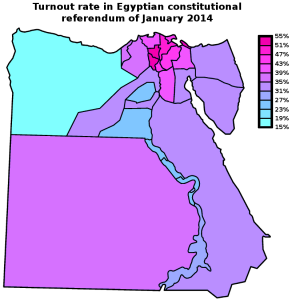
Map: Egypt 2014 constitutional referendum - Turnout by governorate

Egypt 2014 constitutional referendum - Turnout by governorate

Last Sunday, Egypt’s Supreme Electoral Committee announced the results of the referendum on the new constitution: no less than 98.1% of Egyptian voters had cast a vote in favour of the new text. That Eastern Block-style result should, however, be placed in the context of a turnout of just 38.6% — surely a less resounding affirmation of the new regime than the army would have hoped. Turnout reached up to 51-53% in the governorates of Menofiya and Gharbiya, in the Nile Delta, and Port Said; but it stayed under 24% in the governorates of Matrouh, Fayoum, and upriver in Sohag and Qena.

How does this result compare with the turnout and “Yes” vote in 2012, when it was the Muslim Brotherhood government that was pushing through a constitutional referendum? In addition, what does the turnout map reveal about the political geography of Egypt? The current referendum was of course boycotted by the Muslim Brotherhood, as well as by the most radical of the revolutionary groups, the April 6 Movement. The April 6 Movement is relatively small, however, and the constitution was supported by many other liberal and radical groups (and the extent of popular support for the liberal and leftist groups is in any case in doubt). So were the areas of low turnout correlated to areas of high support for the Muslim Brotherhood?

The trick in comparing the results of this year’s referendum with the one two years ago is that you’re dealing with two separate elements: the turnout, affected as it might be by boycotts and apathy, and the percentage of actual “Yes” voters. This year, turnout was low, at least by international standards, but almost everyone who went out to vote, voted “Yes”. (Considering the current climate of repression, opponents might also not have dared to come out to vote “No”). However, in the 2012 referendum turnout was even lower, at 32.9%, and in addition, there was a substantive number of people who came out only to vote against the Muslim Brotherhood’s constitution.

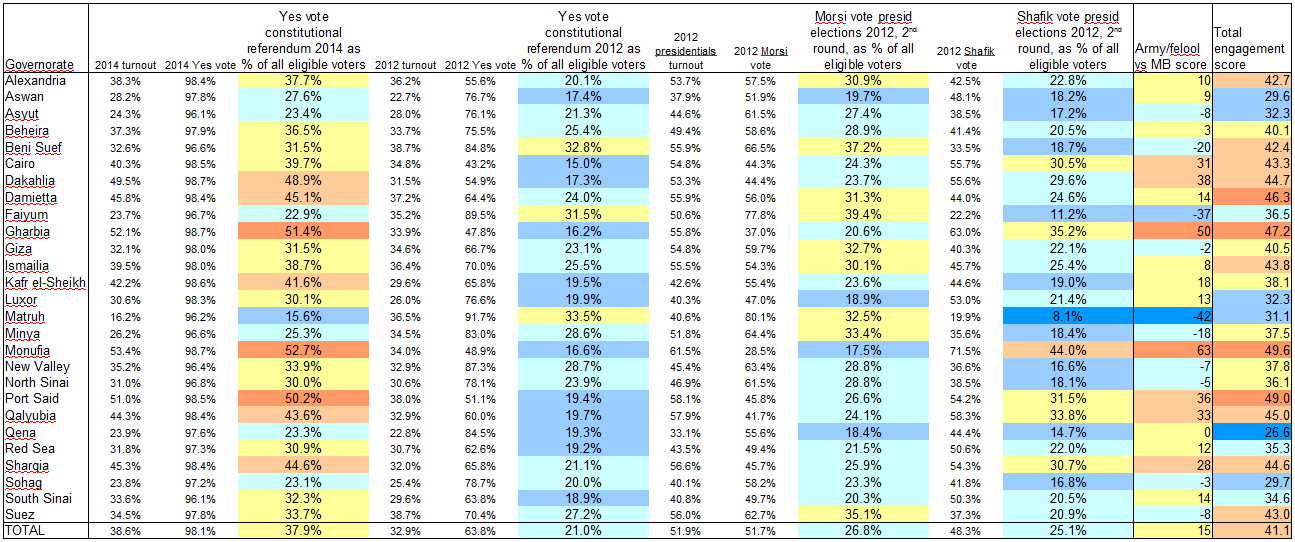
To take account of both elements, in the table below (click for full size), I’ve taken the turnout and “Yes” vote percentages in each referendum and calculated the number of “Yes” voters as percent of all eligible voters. I also did the same for the results of the second round of the 2012 presidential election, when Brotherhood candidate Mohamed Morsi faced off against Ahmed Shafik, widely associated with the ancien regime, army and “felool”.

Table: Egypt constitutional "Yes" votes of 2012 and 2014 in comparison

The constitutional "Yes" votes of 2012 and 2014 and the 2012 presidential election results (second round) in comparison, taking into account turnout rates

In short, especially when you take turnout into account, the army’s referendum this year fared much better than the Brotherhood’s proposal two years ago. Then again, context is important. The army inundated the airwaves and streets with propaganda, whereas even just carrying flyers against the constitution could get you harassed or arrested. Morsi’s government was repressive in its own ways, but the campaign back then wasn’t anywhere as one-sided, with the opposition holding public rallies in Tahrir Square and elsewhere. The direct comparison in this table shouldn’t therefore be taken simply at face value. One thing it can be useful for, I think, is to identify local and regional electoral patterns.

In the table above, I added two extra columns at the right end, based on formulae that I freely made up on the spot. I rather crudely labelled the first one the “Army/felool vs MB score”, which I know overly simplifies things. The formula is very straightforward:

Yes vote 2014 as percent of eligible voters + Shafik vote as percent of eligible voters - Yes vote 2012 as percent of eligible voters - Morsi vote as percent of eligible voters.

Egypt: "regime vs MB" score by governorate [Map]

"Regime vs MB" score: The Yes vote in the 2014 constitutional referendum and the Shafik vote in the 2010 presidential elections, minus the Yes vote in the 2012 constitutional referendum and the Morsi vote in the 2010 presidential elections (all as percent of all eligible voters)

By this calculation, the Faiyum and Matruh governorates are the only real Muslim Brotherhood strongholds, where Morsi and the 2012 referendum fared much better than nationally, and Shafik and the 2014 referendum fared much worse. Beni Suef and Minya follow at some distance. Those are also the only four governorates where a higher percentage of all eligible voters turned out to vote “Yes” in the 2012 constitutional referendum than in the 2014 one, though the difference in Beni Suef and Minya was small. (It might be worth noting, though, that Morsi didn’t win Matruh in the firstround of the 2012 presidential elections; it went for Abdel Moneim Aboul Fotouh, a former Brotherhood leader who built his campaign on a hybrid coalition of moderates and Salafis).

On the other hand, by this calculation, Monufia and Gharbia are by far the strongest army/establishment bulwarks, but Dakahlia, Port Said, Qalyubia, Cairo and Sharqia all rank highly here too.

There is another, less obvious dimension of these results though, which interested me when I noticed that the people of Aswan, Qena, Sohag and Luxor appear to not have particularly liked any of the choices. In these governorates, both the “Yes” vote in 2012 and that of 2014 (as percentage of all eligible voters) stayed below the national average. And turnout in the second round of the presidential elections there was low enough that both Morsi and Shafik failed to reach their national average score, as percentage of all eligible voters. That’s why I added that last column in the above table. I dubbed it the “engagement score”, but it’s really nothing more than just the average turnout in the three elections.

Egypt: "Engagement score" [Map]

Average turnout in the second round of the 2012 presidential elections, the 2012 constitutional referendum, and the 2014 constitutional referendum

Interesting to me is that Cairo and Alexandria actually rank somewhat highly on this score. All of the options on these ballots (the two draft constitutions and the candidates in the second round of the presidential elections) were disliked by some or all of the liberal and left-wing groups — which you’d expect to be be overrepresented in the two main cities. But if their supporters took part in the boycotts, it didn’t have a marked additional effect: turnout in the two cities was actually around or a little above average at each of these three times. Which is a lot more than can be said about the upstream and some of the out-country governorates. So this might further underscore the relative impotence of these groups. The call from some radical groups, like the Road of the Revolution Front, to take part in the 2014 referendum but vote “No” also obviously achieved little.

The correlation between the two above maps also suggests a strategic problem for the Muslim Brotherhood (though it is obviously more concerned with more immediate threats at the moment). Most of the governorates where the army/regime appeals least, judging on the 2014 results and Shafik’s 2012 result, also seem to be among the lesser-energized governorates overall, which weren’t particularly motivated to turn out by either of the two sides in these elections/referenda.

After all, Faiyum, Matruh and Minya didn’t just massively boycott the 2014 referendum; in 2012 turnout there was barely over the national average, and in the 2012 presidentials Morsi can’t have inspired them too much either, because turnout was either just around the national average or, in the case of Matruh, much below it. (Beni Suef is the exception, with an above-average ‘engagement score’).

Comments Off on Failure or success for the regime? The constitutional referendum results in comparison and the political geography of Egypt