Browsing the archives for the exit polls tag.

Greece, elections 2015: How did the pollsters fare? Not too shabbily

European Politics, International Politics, Politics

In the aftermath of the momentous Greek elections, this seems worth mentioning: the Greek exit polls were fairly close to the mark, and the last pre-election polls approached the actual election results almost as closely as the exit polls.*

The latter, especially, seems impressive, not least because their performance was hardly a given. Ahead of the May 2012 elections, the pollsters entirely failed to capture the dynamic of the electorate. (Admittedly, it’s not easy to poll a watershed election which all but broke up the entire Greek party system, and they did approach the results of the June 2012 elections much more closely.)

The 2015 elections: how the pollsters did

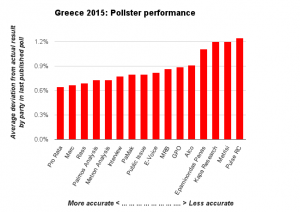
Chart: Greece 2015 elections: Pollster performance

Click to enlarge: How closely did the last pre-election polls approach the actual election results?

This time, a Pro Rata poll which was in the field 5-6 days before the elections pegged the numbers closely enough to the actual results that it was off by an average of just 0.6% by party. Even the “worst” poll was only off by an average of 1.2% by party.

Interestingly though, to the extent that the polls in the last few days before the elections did miss the mark, there was a distinct pattern. When you calculate the average of each pollster’s final poll, it turns out to have understimated every anti-bailout party, whether on the left or right (Syriza, XA, KKE, ANEL), and overestimated every pro-bailout party on both the left and right (ND, Potami, PASOK, KIDISO). Sometimes the deviations were tiny (like a tenth of a percentage point), but it’s still a striking pattern.

In particular, the average of the final polls had the incumbent government party, New Democracy, 1.8% higher than the share of the vote it eventually received, while it had the Independent Greeks 1.1% lower.

For more data and information, read on below the fold.

Continue Reading »
Comments Off on Greece, elections 2015: How did the pollsters fare? Not too shabbily

More exit poll comparisons, 2000-2004-2008

Politics, Presidential Elections, US Elections, US Politics

Continuing on the previous post, which covered basic demographic categories of gender, race, age, income, education and party ID, here are several other side-by-side comparisons between the exit poll data on the 2000, 2004 and 2008 presidential elections.

Among which groups has Obama done better or worse, and by how much, than Kerry and Gore did? A look at first-time voters, religious groups, married versus unmarried voters, union households and gun-owning households, urban, suburban and rural voters, and voters from the different regions of the country.

When looking at these charts, keep the overall, national data in mind. Gore got 48.4% of the vote, Kerry 48.3% and Obama 52.6% – so that’s the standard. If Obama gained 5% or more in a demographic group compared to Kerry and Gore, it means he made bigger advances in this group than on average; if he gained 3% or less, it means he “underperformed” in comparison with other demographic groups.

FIRST TIME VOTERS

Share of voters: 9% in 2000; 11% in 2004; 11% in 2008.

Yes, that’s one huge blue victory in 2008 – the contrast with previous cycles, in which the Democratic candidate already had the advantage, is enormous. It’s an advance that dwarfs all others in this overview.

PROTESTANTS

Share of voters: 54% in 2000; 54% in 2004; 54% in 2008.

Note that the increased turnout that Obama inspired among African-Americans (and, presumably, a corresponding decreased turnout among the white evangelical vote Bush mobilised so successfully in 2004) should have helped amplify Obama’s gains among Protestants.

Continue Reading »

13 Comments

Selected exit poll comparisons, 2000-2004-2008

Politics, Presidential Elections, US Elections, US Politics

MALE VOTERS

Share of voters: 48% in 2000; 46% in 2004; 47% in 2008.

—–

FEMALE VOTERS

Share of voters: 52% in 2000; 54% in 2004; 53% in 2008.

Compared to John Kerry’s vote, Barack Obama gained about equal ground among both men and women. But compared to Al Gore’s performance, Obama gained much extra ground among men, but little among women.

—–

WHITE MEN

Share of voters: 39% in 2000; 36% in 2004; 36% in 2008.

—–

WHITE WOMEN

Share of voters: 42% in 2000; 41% in 2004; 39% in 2008.

The same distinction noted above is even more apparent among white men and women. Obama won 4-5 points among white men compared to both Gore and Kerry, but won only 2 among white women compared to Kerry, and actually did less well than Gore did. Turnout among white women was also weaker in proportion to turnout among white men than it was in 2004 (i.e, it was still higher, but less so.)

—–

BLACKS/AFRICAN-AMERICANS

Share of voters: 10% in 2000; 11% in 2004; 13% in 2008.

Speaks for itself. Note also the effect of the high turnout on the share of black voters in the electorate.

—–

LATINOS/HISPANICS

Share of voters: 7% in 2000; 8% in 2004; 9% in 2008.

Obama’s surge among Latinos this year (who said Hispanics would never vote for a black man?) has pushed the Republicans back to pre-2000 levels of support. On a side note, Latinos were among the very rare groups where the Nader candidacy still registered in 2004, possibly thanks to his VP candidate Peter Camejo.

Continue Reading »

15 Comments