Browsing the archives for the US Elections category.

More exit poll comparisons, 2000-2004-2008

Politics, Presidential Elections, US Elections, US Politics

Continuing on the previous post, which covered basic demographic categories of gender, race, age, income, education and party ID, here are several other side-by-side comparisons between the exit poll data on the 2000, 2004 and 2008 presidential elections.

Among which groups has Obama done better or worse, and by how much, than Kerry and Gore did? A look at first-time voters, religious groups, married versus unmarried voters, union households and gun-owning households, urban, suburban and rural voters, and voters from the different regions of the country.

When looking at these charts, keep the overall, national data in mind. Gore got 48.4% of the vote, Kerry 48.3% and Obama 52.6% – so that’s the standard. If Obama gained 5% or more in a demographic group compared to Kerry and Gore, it means he made bigger advances in this group than on average; if he gained 3% or less, it means he “underperformed” in comparison with other demographic groups.

FIRST TIME VOTERS

Share of voters: 9% in 2000; 11% in 2004; 11% in 2008.

Yes, that’s one huge blue victory in 2008 – the contrast with previous cycles, in which the Democratic candidate already had the advantage, is enormous. It’s an advance that dwarfs all others in this overview.

PROTESTANTS

Share of voters: 54% in 2000; 54% in 2004; 54% in 2008.

Note that the increased turnout that Obama inspired among African-Americans (and, presumably, a corresponding decreased turnout among the white evangelical vote Bush mobilised so successfully in 2004) should have helped amplify Obama’s gains among Protestants.

Continue Reading »

13 Comments

Selected exit poll comparisons, 2000-2004-2008

Politics, Presidential Elections, US Elections, US Politics

MALE VOTERS

Share of voters: 48% in 2000; 46% in 2004; 47% in 2008.

—–

FEMALE VOTERS

Share of voters: 52% in 2000; 54% in 2004; 53% in 2008.

Compared to John Kerry’s vote, Barack Obama gained about equal ground among both men and women. But compared to Al Gore’s performance, Obama gained much extra ground among men, but little among women.

—–

WHITE MEN

Share of voters: 39% in 2000; 36% in 2004; 36% in 2008.

—–

WHITE WOMEN

Share of voters: 42% in 2000; 41% in 2004; 39% in 2008.

The same distinction noted above is even more apparent among white men and women. Obama won 4-5 points among white men compared to both Gore and Kerry, but won only 2 among white women compared to Kerry, and actually did less well than Gore did. Turnout among white women was also weaker in proportion to turnout among white men than it was in 2004 (i.e, it was still higher, but less so.)

—–

BLACKS/AFRICAN-AMERICANS

Share of voters: 10% in 2000; 11% in 2004; 13% in 2008.

Speaks for itself. Note also the effect of the high turnout on the share of black voters in the electorate.

—–

LATINOS/HISPANICS

Share of voters: 7% in 2000; 8% in 2004; 9% in 2008.

Obama’s surge among Latinos this year (who said Hispanics would never vote for a black man?) has pushed the Republicans back to pre-2000 levels of support. On a side note, Latinos were among the very rare groups where the Nader candidacy still registered in 2004, possibly thanks to his VP candidate Peter Camejo.

Continue Reading »

15 Comments

How did North Carolina end up the ultimate toss-up state? Reviewing county data

Politics, Presidential Elections, US Elections, US Politics

AP and NBC yesterday belatedly called North Carolina for Obama, making the state’s result the second last to come in. Only Missouri hadn’t been called yet. So how did it become so close? Facing South has a good summary up of the main strategical and political reasons. But I would like to look more specifically at the geography and demographics of the race.

For Obama to win the state required a 12.4% swing (that being the margin by which Bush was elected in 2004). He got a 12.6% swing. Which parts of the state pushed Obama over the line? Where did his efforts of persuasion fall short? What demographics were at play? An in-depth look.

Continue Reading »

5 Comments

A Post-Mortem on Conservative Election Post-Mortems

Presidential Elections, US Elections

The election results from this past Tuesday provided some sobering news for Republicans: in addition to losing the White House, the GOP saw at least six senate seats and nineteen or more congressional seats switch to the Democratic Party.  Coupled with the five senate seats and 32 House seats lost in 2006, the Republican Party has seen a decisive public repudiation of its candidates and its philosophy over the past two years.  In short, that’s two thumpin’s in a row, something the Republicans haven’t suffered since the last Great Depression.

Out-of-work Republicans light out for the territories

Out-of-work Republicans light out for the territories

Not only have the office-holders lost their jobs, but their many aides, staffers, and personal hangers-on  will now have to try to find honest employment in a political environment that is no longer dominated by the GOP.  The massive exodus of unemployed Republicans after January 20 promises to be the most dolorous migration this country has witnessed since the Trail of Tears.  Despair not, I understand Walmart might be hiring.

Conservative media pundits, on the other hand, will still defy all logic by retaining their jobs.  That leaves them to explain how Barack Obama and the Democrats could have managed what would have been unthinkable, or at least unutterable, on November 3: an electoral victory that finds the opposition in charge of the presidency and both houses of Congress for the first time since 1994.  For most of these pundits, the natural reaction is one of complete disbelief.

Continue Reading »

1 Comment

Election night toolkit: data and resources

Congressional Elections, Politics, Presidential Elections, US Elections, US Politics
  • An Observer’s Guide to Election Night, by our own JoefromChicago. There are 435 congressional races, 35 senate races, and 11 gubernatorial contests today, Joe points out, and “these races merit attention in their own right, but they also may be early indicators of the way the presidential race will turn out”. A convenient list of the races you should be paying attention to as you watch the presidential results come in, ordered by time of night.


  • Swing State Project: Poll closing times & Key races, by DavidNYC. Very handy country map with the poll closing times, and a list of key House, Senate, gubernatorial and state legislative races, arranged by poll closing times (linked in is also a list of key ballot measures).


  • The American Prospect 2008 Election Night Guide. Comprehensive guide, encompassing six sections, among which an overview of key swing state counties, a list of Senate races that would pave the way to a utopian 60 Dems, a review of bellwether House races, and a number of ballot initiatives to watch.


  • US Election Atlas, by Dave Leip. A long-standing, invaluable elections resource. Browse the results of previous elections going back to 1789 (no, really). Not just by state – results by individual county are available back to 1960.


  • Google Maps Historical Election Results, going back to 1980. Click or zoom into a state or county – the map will show you the winner and moreover, with a click of the mouse you get both the electoral breakdown and basic demographic data (income, age, race/ethnicity). Click on the National Almanac map, which should show up on the right, and you can find additional demographic info on language and occupation by state or group of states. The Google Maps historical election results tool should also be available on Google Earth (h/t Marc Ambinder).


  • Census 2000 Interactive map. Zoom in on states and counties to find demographical data on population density, racial composition and black or hispanic population.


  • Ancestries by state, tables derives from the US Census Bureau’s American FactFinder. OK, so only very tangentially relevant, but very interesting. (Keep an eye on those Hillary-loving people of “United States American” – i.e., non-ethnic – ancestry in the Appalachians and the Border South, which are very unlikely to go Obama.)


  • Cleveland Plain Dealer Data Central, for all your political data from the state of Ohio. Aside from the interactive map of county-level results back to 1960, which overlaps with the above resources, there’s an interactive map that breaks down the voter registration and demographics on both congressional district, county and ZIPcode level. And a map and table showing how voter registration has gone up or down since 2004 by county. And a useful explanation, with map, of how Ohio may be a swing state, but inside Ohio there really are but a dozen of swing counties.


  • Counties to watch according to Marc Ambinder in Pennsylvania, North Carolina, Nevada and Colorado and in Florida, Virginia, Ohio.
     
Comments Off on Election night toolkit: data and resources

Obama’s polling compared to Kerry’s, Gore’s and Clinton’s – final day update

Politics, Presidential Elections, US Elections, US Politics

My comparison from a week and a half ago of how Obama’s polling numbers match up with Kerry’s polling in 2004, Gore’s in 2000 and Clinton’s in 1996 has surprisingly become the most visited page on this blog since. Considering the interest, I thought it would be good to provide a last-day update on how the comparison is shaping up at the end of the campaign.

There are four daily tracking polls this year that also conducted daily tracking polls in either 2000 or 2004 or both. The comparison between the races shapes up differently depending on which pollster’s numbers you look at. The best known is Gallup, and this graph compares Obama’s performance versus McCain in the Gallup poll with Kerry’s, Gore’s and Clinton’s performance against their Republican opponents:

Gallup polling: Obama vs McCain in 08 compared with Kerrys, Gores and Clintons polling

Looking good indeed; the 11-point lead Gallup showed for Obama in its final presidential estimate last night is on par with its election-day polling lead for Bill Clinton in ’96. While Clinton’s ample lead gradually eroded over the course of the last two weeks of campaigning, Obama’s held steady. Quite the difference with the nailbiters the last Gallup polls out predicted for the 2000 and 2004 races.

TIPP is a polling firm you may not have heard of; it has conducted a daily tracking poll for the Investors Business Daily this year, and for IBD and the Christian Science Monitor in earlier years. Of the seven tracking polls that were conducted on a daily basis in the last two weeks, this poll has tended to show the smallest Obama leads of all. When McCain’s chief strategist Steve Schmidt asserted, two weeks ago, that “the McCain campaign is roughly in the position where Vice President Gore was running against President Bush,” the TIPP poll was the only poll that confirmed his assertion.

Today, however, brings good news for Obama supporters: after oscillating between a 1-point and 5-point lead for Obama for two weeks, TIPP published a final estimate last night that had Obama leading by 7.2%. And that makes the comparison over the years look like this:

Continue Reading »

Comments Off on Obama’s polling compared to Kerry’s, Gore’s and Clinton’s – final day update

Daily tracking polls update: Steady as she goes edition

Politics, Presidential Elections, US Elections, US Politics

Chart 1: The daily tracking polls (click to enlarge)

In 24 hours time, we will know a lot more – but for now, we’re still going on polls. OK, on polls and early voting numbers by party affiliation.

The daily tracking polls on this final day of campaigning are surprisingly, and reassuringly, stable. No tightening nor expanding of Obama’s lead; just a seemingly random mix of minor fluctuations. Research 2000 has Obama’s lead down a point, ABC/WaPo has it down two. But Rasmussen and Zogby have it up a point, and the two Gallup likely voter models are up by two and three points respectively. The IBD/TIPP poll had Obama’s lead plummeting from five to two points yesterday, and has it back up to five again today.

All in all, the average of the tracking polls (taking the expanded likely voter model of Gallup’s) has Obama’s lead up a tick from 6.4% to 7.0%. That’s higher than it’s been in a week. In the last five days it’s gone up from 5.6% to 7.0%, so the last minute mojo would seem to be more Obama’s than McCain’s.

There is a little more disagreement again between the pollsters about the actual size of Obama’s lead though. Basically there’s two clusters. Rasmussen, Hotline, Research 2000, IBD/TIPP and Zogby all have Obama’s lead at 5-7 points. I’d go with the crowd here, but Gallup and the ABC/WaPo poll disagree. They have it at 9 points (WaPo) or 11 points (Gallup, both likely voter models). In fact, they’ve had it at 8-11 points for four days now, even as the other pollsters oscillated between 2 and 7 points.

Continue Reading »

2 Comments

Riding the red lands: field reports from the media

Media / journalism, Politics, Presidential Elections, US culture, US Elections, US Politics

While the reporters assigned to presidential candidates are condemned to a mix of grind and hype, reporters who get the chance to survey the country often come up with the best stories. Interviewing voters, sampling local opinion, sketching the political geography, they write the field reports, a ubiquitous genre of its own. No self-respecting election-time newspaper is complete without one.

A lot of them, of course, end up being cookie-cutter stuff: a little bit of this, a little bit of that, and done is the day’s work. Here’s a few from the last couple of days I thought more interesting (h/t to the Electoral Map, where I think I found most of these on the “Morning Reading Lists”). The common thread: Obama’s chances to win over red states or counties.

Battling on the Other Side’s Turf
Washington Post
1 November

Best of the bunch: in-deph local flavour from Southside Virginia.

Heartwarming? Yes; moving stories, a hopeful narrative, characters who feel real and alive. Feeling that the reporter understands the local scene? Pretty high. Strategic survey? Not so much; demographic analysis doesnt take much space here. Evocation of historical legacies, racial and/or industrial? Present. Nuanced? Yes. Topical? Yes – US Rep. Virgil Goode, portrayed here as a well-established incumbent, is unexpectedly facing a tight race, according to the latest polls.

Why the New Virginia Is Leaning Toward Obama
Time
27 October

Timely dispatch from exurban Prince William County.

Heartwarming? Not so much. More of an analytical take, and what anecdotes are there are fairly depressing. Feeling that the reporter understands the local scene? High enough; he studied the numbers and knows where to look. Strategic survey? Yes. The choice of location itself is an attempt to pinpoint the very frontier zone where the elections will be decided. Evocation of historical legacies, racial and/or industrial? Not so much. Nuanced? Yes. Topical? There’s the account of a fearmongering McCain coordinator, but you might have seen it already.

Obamalina
The Nation
22 October

Long review of how the Obama campaign made North Carolina into a toss-up state.

Heartwarming? In a combative way. Fuelled more by awe at the campaign’s success than touching personal anecdotes. Feeling that the reporter understands the local scene? High. He’s from there and he’s got the political scars to prove it. Strategic survey? Yes: it’s all about pinning down the overall Obama strategy and why it’s successful (“it’s the economy, stupid”). Evocation of historical legacies, racial and/or industrial? Yes, but of the weary rather than wistful type. Nuanced? Not so much. Topical? No immediate hook beyond the electoral fate of the state itself.

Westmoreland County up for grabs
Pittsburgh Post-Gazette
28 October

Gritty impressions from a Pennsylvanian county that went for Bush and loved Hillary.

Heartwarming? Not really. The news is depressing – meet the working class McCain Democrats. But the people are real. Feeling that the reporter understands the local scene? Mwah. You keep wanting her to dig a little deeper. Strategic survey? Not so much. Though the description of how the polarisation between high-income, Republican subdivisions along Route 30 and low-income, Democratic riverside settlements are all muddled up this year should rouse the political geographer in you. Evocation of historical legacies, racial and/or industrial? Some wistful type of the latter. Nuanced? Fairly. Topical? Considering McCain’s decision to stake his fate on Pennsylvania and the racial/cultural resentments there, yes.

Continue Reading »

Comments Off on Riding the red lands: field reports from the media

The fear and loathing of campaign reporting, and its impact on the news you see

Media / journalism, Politics, Presidential Elections, US Elections, US Politics
Last week, TNR published an in-depth look at “what covering a two-year campaign does to the soul of a journalist” by Julia Ioffe. It has lots of colourful anecdotes as Ioffe interviews the media mercenaries who trail the candidates across the country for sometimes years on end.

The week before, a post by Ezra Klein on TAP about “the weirdness of campaign reporting” reflected on just how mindnumbing the work of campaign reporting is while reviewing a lengthy article on the same subject in GQ. The GQ article was written by Michael Hastings, a journalist Newsweek sent to embed on the campaign, who eventually quit in exasperation at the souldeadening experience. It’s a witty story, if you like your humor dry and dark.

So just how bad is it? And maybe more importantly, what effect does it have on your news experience?

It’s pretty bad, judging on Ioffe’s article, which starts off as if it were setting the stage for a tense road movie:

CNN political correspondent Candy Crowley has taken to running through a checklist before bed. Every night she travels with the Obama campaign, she orders a wake-up call, sets one regular alarm and one back-up on her cell phone, which she places strategically out of slapping distance across the room. Then she writes down her vitals: What city is she in? What time zone? What time does she have to be out of the hotel room the next morning? What day is it? With that, she can drift off before the next day’s campaign coverage.

Most of the time, though, Crowley is so scared to oversleep that she’s awake and waiting, long before the alarm [..] rings. “After the previous campaign, it took me a good month to stop waking up in the middle of the night in a panic that I’ve missed something,” Crowley says.

Continue Reading »

1 Comment

An Observer’s Guide to Election Night

Congressional Elections, Politics, Presidential Elections, US Elections, US Politics

Finally, the election campaign is nearing its demise, and its death throes will be televised! But what to watch? And more importantly, how to watch? The presidential election will, of course, attract the most attention, but there are also 435 congressional races, 35 senate races, and 11 gubernatorial contests across the nation. These races merit attention in their own right, but they also may be early indicators of the way the presidential race will turn out, especially in battleground states like Pennsylvania, Indiana, North Carolina, Florida, Missouri, Colorado, and Nevada. Most networks won’t focus on races below the senate level, so the internet (which, as you may have suspected, is a series of tubes) is the best place to follow the local contests. I’ll be checking in with NPR. Here then, is a convenient list of the races that you should be paying attention to as you watch the presidential results come in:

Continue Reading »

10 Comments

The Best News I’ve Seen All Year

Presidential Elections, Uncategorized, US Politics

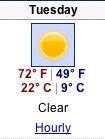
This is from Weather Underground’s forecast for Columbus, Ohio on Tuesday, November 4th, 2008.

Election day.

I was here in Columbus for the election in 2004. It was a miserable, cold, rainy day. Brave (and soggy) souls stood in lines anyway, but the weather depressed turnout. And Bush won Ohio.

It was typical weather for November in Columbus, which makes this all the more wonderful. Sunny, clear, and a high of 72. Seventy-two! Amazing.

This is very, very good news.

It’s not just Columbus, it’s all of Ohio. (Cincinnati’s forecast is identical, Cleveland’s high is 67 rather than 72 — still lovely!) And as Pennsylvania tightens, Ohio’s status as an uber-battleground state is reinforced.

Good weather will help the Obama campaign strategy of deploying “line managers,” too. I recently received an email from the wonderful Valli Frausto, explaining the role of line managers (and inviting me to be one):

Based on the amazing turnout already for Early Vote at Veterans Memorial, the campaign is expecting record-breaking turnout across Franklin County for Election Day! This is great news, but it also means that there will be some long waits for voters at certain polling places. Let’s make those waits feel as short as we can – and keep those voters in line and get them into the polling booth!

How? Line managers!!

On Election Day, the line manager is a critical role inside the Obama campaign.

As a line manager, you will work outside a polling location at an Obama Target precinct. It’s a really fun and totally new way to be a part of our movement for change. Handing out water and hamburgers, rocking out to a local band playing a set, and just talking with folks – it’s a great way to participate and make a tremendous difference while having a great time.

And, because of the work you do, people that would have left without voting actually stay and vote. You personally bank real votes for Barack!

I love the idea. Not sure yet if I can do it. (I’ve been sick and am not sure if I’ll be well enough in time. Hacking and coughing and looking haggard doesn’t seem like a great morale-raiser.)

Like the election prognostications, the weather forecast is subject to change of course. But I’m hopeful.

1 Comment

Early Voting, Coastal Carolina Style

Politics, US Elections, US Politics
Approaching the New Hanover County Senior Center

Approaching the New Hanover County Senior Center

Visit Wilmington, North Carolina in the fall and you’ll never leave.  Saturday, November 1 was a bright, crisp day with temperatures climbing into the mid-70’s under a clear blue sky.  It was also the last day for early voting.  I stopped by the New Hanover Senior Center to check out the action and I was amazed.  The line snaked through the grounds and staffers and volunteers were telling newcomers to expect a three hour wait.  I waved to three guys carrying “Vote for Jesus” signs as I was coming in.  A woman with a McCain bumper sticker on her chest was handing out handbills.  Cars were winding in and out of the crowds looking for parking and staffers were reading instructions to voters waiting to get in the building.

Continue Reading »

2 Comments
« Older Posts
Newer Posts »