Browsing the archives for the usa tag.

Polls dramatically tightening in Pennsylvania, but does it matter?

Politics, Presidential Elections, US Elections, US Politics

Here’s something to feed your jitters: three new polls on Pennsylvania, all showing Obama ahead by just 4-5%.

How should we regard them? And will the electoral fate of Pennsylvania matter in the big picture anyway? First, a rundown of the polls in question:

  • Thursday saw the release of an NBC/Mason-Dixon poll that had Obama ahead by just 4 points, 47% to 43%.

Not reassuring: The last time Mason-Dixon polled the state was in mid-September, when it had Obama ahead by 2. At the time (McCain was still riding his post-Convention bounce), that was comparable with what other pollsters were finding: six other polls conducted around the same time ranged from a tie to a 5-point Obama lead.

Possible comfort: The poll was of a mere 625 likely voters, making for a relatively high 4% margin of error.
Possible comfort: Mason-Dixon, Nate Silver pointed out, “has .. had a Republican “lean” this cycle of perhaps 2-3 points. They are quite frequently the most favorable number for John McCain in any given state.”

The Pollster.com trendlines for the state since 4 February, when Internet polls are filtered out and the trend smoothing is set to more sensitive.

Continue Reading »

1 Comment

Spread the wealth? What Americans think

Economy, Politics, Presidential Elections, US Economy, US Elections, US Politics

In my post, after the third presidential debate, about McCain’s efforts to make “spreading the wealth around” sound like the most ominous thing, I quoted Ezra Klein as saying that “for most folks, spreading the wealth around probably seems like a good idea” right now.

This is correct, Brian Schaffner of the CCPS argued yesterday at his new home on pollster.com. Taking as lead how the ABC/WaPo poll hasn’t shown any movement this month on the question which candidate is trusted more on the question of taxes, he digs up data showing so from a 2003 survey conducted by NPR, the Kaiser Family Foundation and the Kennedy School of Government.

Moreover, in case you’re feeling doubtful about those sponsors, the same thing is largely confirmed by Gallup data, which the polling firm’s in-depth look at the issue on Thursday revealed.

Schaffner argues that the McCain camp’s insistence that Obama’s proposal to raise taxes on the top 5% of income-earners smacks of class struggle and socialism doesn’t drill into much of a popular perception. It isn’t surprising “that McCain hasn’t gotten much traction by criticizing the fact that Obama wants to increase taxes for high income Americans,” Schaffner writes, because the 2003 survey actually showed that most Americans believe “high income people pay less than their fair share”. Over 60% of Independents, over 70% of Democrats and even a plurality of Republicans  agreed. Barely over 10% of independents and some 30% of Republicans, on the other hand, thought that high income people “pay more than their fair share”:

The Gallup polling data doesn’t directly address the question whether wealthy Americans pay enough taxes, but it does show a majority of Americans believing that “the distribution of money and wealth in this country” isn’t “fair”. Throughout intermittent polls in the last twenty-odd years, an ample majority opined that wealth should be “more evenly distributed among a larger percentage of the people,” while just 27-37% believed that the current distribution is fair:

Two details strike me in this graph. The opinion that “spreading the wealth around” seems like a good idea isn’t just something that’s coming up “right now”, in the face of a financial crisis; it’s actually been pretty consistent through the years. But there’s two kinds of variations over time.

Continue Reading »

1 Comment

Daily tracking polls update: “Looking OK now” edition

Politics, Presidential Elections, US Elections, US Politics
Tracking polls update, 31 October

Chart1: Daily tracking polls update, 31 October

Three days ago, I was feeling nervous about a sudden seeming lurch-let towards McCain in the daily tracking polls. This in spite of repeated posts by the experts insisting that there was no actually meaningful tightening going on, it was mostly just a question of statistical artifacts.

By this morning, Pollster.com’s status update did acknowledge that there had been some movement: “If you look at our national trend chart, we definitely show a narrower Obama margin now (5.4% as of this writing) than about a week ago.” Obama’s current national trend estimate, Mark Blumenthal explains, now stands about a point lower than his high of 50.9% a week ago, and McCain’s current estimate is slightly less than two percentage point higher than his low of 42.2% on October 12.

However, there’s still little to worry about, basically, as he points out the obvious to calm our nerves: “[T]ime is short and Obama’s lead still looks daunting. [..] Obama continues to lead on every national poll and yesterdays tracking updates show no decisive shift in either direction.”

Today’s tracking poll numbers certainly help sooth the jitters, as most actually show movement towards Obama (see Chart 1). Over the last two days, the ABC/WaPo, IBD/TIPP and Rasmussen daily trackers all have Obama’s lead back up 1 point, Zogby has it up 2, and the Gallup samples have moved back in Obama’s favour too: the regular voter and expanded likely voter samples both by 2 points and the traditional likely voter sample by no less than 5 (from 3% to 8%).

The result is that the average of all daily tracking polls has Obama’s lead back up by 1 point from +5.6% to +6.6%, after it had fallen by 2.7 points in the previous four days.

Continue Reading »

Comments Off on Daily tracking polls update: “Looking OK now” edition

Massive early voting … the wonder, the worry, the role of race

Politics, Presidential Elections, US culture, US Elections, US Politics

WSB TV down in Georgia reports a story that’s at once heartwarming and horrifying: Clayton County voters on Monday, the first day of advance voting, stood in line for 12 hours to vote. Twelve hours!

While the polls officially closed at 7 p.m. Monday night [..], the line to vote at the Frank Bailey Senior Center in Riverdale didn’t clear up until 1 a.m. Tuesday morning.

Clayton County voter Patricia Lewis finally voted in Riverdale after standing in line to vote for six hours. “I vote in every election and I couldn’t pass this one up. I think about my dad, about the struggles he went through and for me to vote again is just amazing,” Lewis. [..]

For much of the day, Clayton County voters stood in line for eight to nine hours to cast their ballots.

Channel 2 talked to one poll worker who worked an 18 hour shift. She still didn’t complain about the problems. She said she was just glad to see so many people interested in voting. “It makes me feel good,” said election worker Beatrice Lyons. “They can just come and stay all night and I’ll be right here.”

Lyons said she saw some people arrive at 1 p.m. Monday and they didn’t vote until 12:45 a.m. Tuesday.

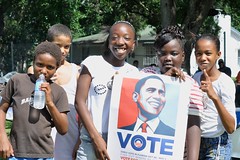
Voting is fun! (Image used under CC license)

Voting is fun! (Image used under CC license)

Now those are moving stories, but once again I am just the foreigner with his mouth agape: how is this possible? I mean, I’m familiar enough with the election day reports to know that it’s fairly common for people in certain states and regions to have to wait in line for hours to vote – many hours sometimes. What’s the deal here – you’re the wealthiest country in the world, and you can’t set up enough polling stations to avoid making voters stand in line for hours on end to exercise their democratic rights?

The political salience of the story, meanwhile, is of course that this is not election day. Election day isn’t for another day. This is advance voting, and already people are standing in line for hours. What massive turnout is taking shape?

Daniel Nichanian at Campaign Diaries (where I got the above link from too) had some stunning numbers yesterday:

Continue Reading »

1 Comment

Daily tracking polls update: the nervous edition

Politics, Presidential Elections, US Elections, US Politics

Is John McCain’s evil masterplan working?

I’m a bit confused about what masterplan, evil or otherwise, McCain would be implementing right now – I mean, ginning up a red scare about Obama the Socialist, really? But it wouldnt be the first time that a tack I considered wholly idiotic seems to work with American voters. (They sometimes work with Dutch voters too, for that matter – though probably not the red-baiting one.)

Either way, the daily tracking polls are showing some tightening of the race. Could be statistical noise, could be real. The movement would probably not be enough to decide the race either way, but still, the lowest estimates of Obama’s lead are getting disconcertingly close to zero:

  • Gallup has Obama’s lead down 3 points today, both in its expanded likely voter model (from 10% to 7%) and its traditional model (from 5% to a perilous 2%);
  • Rasmussen has Obama’s lead down 3 points in two days, from 8% to 5%;
  • Research 2000 has Obama’s lead down 4 points in two days, from 11% to 7%;
  • Zogby has Obama’s lead down a point today to just 4%, after it already fell from 10% to 5% the day before yesterday.
  • The IBD/TIPP poll is stubbornly stuck at a modest 3-4% Obama lead since the 22nd.

All in all, Obama’s average lead in the daily tracking polls has fallen from 8.3% three days ago to 6.0% tonight.

Chart 1: All daily tracking polls

Chart 1: All daily tracking polls

It should be said that there is one non-tracking poll that paints a seriously different picture. A Pew poll out today is showing a delirious 15-point lead for Obama among likely voters, with McCain down at just 38%. John Judis flagged that one (using the poll’s even more favourable numbers for registered voters) to tell us to “start popping the corks”.

The balance is evened out again, however, by the GWU Battleground tracking poll (which I dont include in the graphs because it’s not a daily tracking poll), which has Obama’s lead unchanged at just 3%. So count me in with his colleague Noam Scheiber, who is “still sweating” it.

For an overall picture of all national polls, check out …

Continue Reading »

3 Comments

WaPo/ABC Poll: the difference between white voters in the South and elsewhere

Politics, Presidential Elections, US culture, US Elections, US Politics

This bit of polling analysis caught my attention: Obama does well among whites, very, very well indeed. But with one glaring exception: the South. The Southern exception is alive and well:

Obama is outperforming any Democrat back to Jimmy Carter among white voters, getting 45 percent to McCain’s 52 percent. But in the South, it is a very different story. Obama fares worse among Southern whites than any Democrat since George McGovern in 1972.

My electoral map of how whites voted in 2004 already showed that when you single out white voters, it’s not Wyoming and Utah that are the most Republican states, it’s Mississippi, Alabama and South-Carolina. The latest ABC/WaPo poll suggests that even as whites across the country have been remarkably receptive to Obama’s message, those in the South are still very hostile:

Whites in the East and West tilt narrowly toward Obama (he’s up 8 and 7 points, respectively), and the two run about evenly among those in the Midwest. By contrast, Southern whites break more than 2 to 1 for McCain, 65 percent to 32 percent.

That stark divide is not simply a partisan difference. While white Democrats outside the South give Obama margins of 80 points or more, he leads by a more modest 65 points among white Southern Democrats. The Democrat is up 55 points among liberal whites in the region, far under his performance among those voters elsewhere, where he is up by 79 points.

Southern white independents are also far more likely than politically independent whites in other regions to support McCain: They break 62 to 33 percent in his favor. White independents in the West favor Obama by a similarly wide margin, 63 to 34 percent. White political independents in the East and Midwest divide much more evenly.

1 Comment

Would you use the word terrorist there?

Politics, Presidential Elections, US culture, US Elections, US Politics

The news addicts among you will already have seen this one:

Think Progress has the transcript:

[BRIAN WILLIAMS]: Is an abortion clinic bomber a terrorist, under this definition, governor?

PALIN: (Sigh). There’s no question that Bill Ayers via his own admittance was one who sought to destroy our U.S. Capitol and our Pentagon. That is a domestic terrorist. There’s no question there. Now, others who would want to engage in harming innocent Americans or facilities that uh, it would be unacceptable. I don’t know if you’re going to use the word terrorist there.

“Have we really reached the point at which the Republican ticket wants to parse the meaning of the word “terrorist”?,” Steve Benen asks at the Washington Monthly. He also wonders, “does John McCain, who sat silently during the exchange, agree with this?”, before answering his own question: “Actually, he might. ThinkProgress noted a couple of weeks ago that McCain has “repeatedly voted against protecting Americans from domestic terrorists carrying out violence at abortion clinics.”

Violence against abortion providers, fig. 1

Violence against abortion providers, fig. 1, based on NAF data.

What kind of views does Palin’s take spring from? How widespread has the anti-abortion strand of domestic terrorism been? Are there any trends?

Continue Reading »

1 Comment

McCain 2008 = Gore 2000? Matching the numbers from Gallup, ABC, TIPP and Zogby

Politics, Presidential Elections, US Elections, US Politics

A fair bit of attention has been paid in the blogs today to the assertion of McCain’s chief strategist Steve Schmidt that “The McCain campaign is roughly in the position where Vice President Gore was running against President Bush one week before the election of 2000.” It’s met a good dose of scepticism. The WaPo drily annotated the quote as follows:

McCain’s team dismisses the most dire polls — those showing the race nationally with a double-digit lead for Obama. Advisers believe the contest’s margin is in the five-to-seven-point range, about the same deficit, they say, that then-Vice President Al Gore faced at this time eight years ago against then-Gov. George W. Bush. (A Washington Post poll at the same point in the 2000 race showed a tie.)

NBC’s First Read similarly remarked:

[T]he NBC/WSJ poll right before the election found Bush ahead by three among likely voters (47%-44%). But our most recent poll shows Obama up [..] 11 points among likely voters (53%-42%).

In addition, Marc Ambinder points out that the margins are “way different” state-by-state: “Obama’s doing much better in 2008 than Al Gore was in 2000 in the battleground states.”

Now I had a graph up here a week or two ago charting how Obama’s current Gallup numbers compare with the lead or deficit that Kerry, Gore and Clinton faced in the previous three presidential elections. In the days since, Googlers have found this site through at least 27 permutations of searches involving some combination around Gore, Bush, polls, October, historical, 2000, elections, tracking and Gallup. So this is a good occasion to update that post and expand it, not just looking at the Gallup numbers but also those from the ABC, Zogby and TIPP daily tracking polls from 2000, 2004 and 2008.

First off, that chart from last time, based on the Gallup polling numbers from the last four elections. Here’s the update:

Continue Reading »

2 Comments

Too. Many. Daily tracking polls. Update, 22 October.

Politics, Presidential Elections, US Elections, US Politics

The last daily tracking polls update I posted was on 8 October. That’s a lot of daily tracking poll results ago. Yet the bottom line is that nothing much has changed since.

On 8 October, the three-day running average of the daily tracking polls had Obama in the lead by 7%. Today, it has him in the lead by 7.1%. And in the meantime the clock is ticking on, and the window of opportunity for McCain to still close the gap is rapidly closing (or has it already closed?).

One major thing has changed though: there are ever more of the damn things. Daily tracking polls I mean. It seems like no self-respecting pollster can do without one this year (and to think that Gallup didn’t even have one in 2004!).

In early October you already had the long-running Gallup and Rasmussen ones, the Research 2000 one (sponsored by the Daily Kos) and the poll sponsored by Hotline and the alcoholic drinks business Diageo, conducted by FD. Zogby and Reuters started their own on 7 October; Investors Business Daily and the pollster TIPP followed on 13 October, and as of last Monday, ABC and the Washington Post present one as well.

daily tracking polls

Chart 1: All daily tracking polls

If you’re keeping a graph and you were basing any kind of trendline on the average of all daily tracking polls, this – well – sucks. Because every new poll comes with its own house effect, deviating from the others in its own ways. Zogby, for example, started off showing a 2-point lead for Obama when Rasmussen, Gallup and R2000 had it at 8-11 points. Then, just as the Zogby poll had settled nearer to the average, the IBD/TIPP poll came on the market showing Obama in the lead by just 2 points, when the other pollsters had it at 4, 5, 6, 10 and 12 points, respectively. And just when Rasmussen, Zogby, IBD/TIPP and Hotline agreed on a 4-5 point Obama lead last Monday, the ABC/WaPo jumped in with its own tracking poll showing a 9-point lead.

Finally, there was Gallup, on 12 October, providing no longer just data for registered voters, but separate numbers for not just one, but two distinct “likely voter” samples as well, one encompassing a larger universe of voters than the other.

Seriously, you would be put off posting new graphs too.

Which of the three sets of Gallup numbers do you feature? How do you deal with how the ups and downs in your average reflect some new poll having been added into the mix as much as any genuine shift in the numbers? And how meaningful do any of the numbers still seem anyway, when on almost any given day the five-to-nine sets of numbers you’re looking at have Obama’s lead anywhere between 3 and 11 points? (And that’s just the daily tracking polls!)

Chart 1 above, if you click it to enlarge, shows how messy and, by implication, uncertain it all is. The pollsters are all over the map in pinpointing Obama’s lead. But saying that is also identifying the obvious commonality. Every one of the daily tracking polls has Obama in the lead, and that’s been true since 17 September, over a month ago.

How big is that lead though?

Continue Reading »

2 Comments

The red and blue states of white* America (*and hispanic)

Politics, Presidential Elections, US Elections, US Politics

On his blog, Brian Beutler remarked upon the difference between the popular perception of California as a bastion of liberal group think and the reality:

California’s a much different kind of “blue” state than is, say, Massachusetts. The dense population centers outside of San Diego and Orange counties are liberal enough to give California’s electoral votes to the Democrats every four years. But for the most part the rest of the state is bright red.

He emphasised the stark contrast between blue and red counties and concluded that in this sense, aside from the San Diego and Orange counties, California “rightfully belongs” in the same category as Oregon and Washington.

While praising Beutler’s post, Ezra Klein offers a somewhat different take. There may be a real contrast between the blue coast and the red inlands, but what it’s informed by is primarily ethnic demography:

The state’s political transformation in recent years has been somewhat ideological, but it’s been much more demographic. Namely, it’s been driven by Latino immigration. Folks think of California and conflate its politics with San Francisco and Hollywood. White, affluent, cultural liberals. But that’s not why California is reliably blue. In 2004, Bush had a five percent margin among white voters.

This sets California apart from a state like Washington, he continues:

In the aggregate, whites everywhere are somewhat conservative. But in other liberal states, they really do swing left. In Washington, Kerry had a six percent advantage among whites. In Vermont, he had an 18 percent advantage. [..] California, by contrast, is a very Democratic state, but somewhat less coherently liberal. It’s solid blue because Latinos are solid blue, not because the place is packed with liberals.

This had me thinking. On a national electoral map, when placed on a scale from clear blue to bright red, California and Washington are the same pale blue. But if the white vote in those states differs so clearly, does it look different elsewhere too? How different would the map of red and blue states look when only showing the white vote?

The 2004 Presidential election – national vote (all groups)

This map of the 2004 election results is not the type youve seen everywhere: the country is not artificially divided up between blue and red states. Instead, it shows the degrees in between. A state where Bush won 100% would be fiery red, a state where Kerry won every vote would be the coolest blue, and a state where the vote was divided equally is white.

This map of the 2004 election results is not the usual type: the country is not artificially divided up between "blue" and "red" states. Instead, it shows the degrees in between. A state where Bush won 100% would be fiery red, a state where Kerry won every vote would be the coolest blue, and a state where the vote was divided equally is white.

Read on and view the map for white voters only beneath the fold.

Continue Reading »

2 Comments

Sometimes a chart is worth 1,000 words

Economy, Politics, US Economy, US Politics

This one comes via Kevin Drum at Mother Jones:

GDP growth vs. median wage stagnation

Yes – between the beginning of 2002 and the end of 2006, the United States GDP grew by over 15% – while the median wage flatlined, not going up by a single percent. In short, the country got ever richer – but the middle class saw nothing of that wealth. It was pocketed in its entirety by the wealthiest, with an assist from the tax cuts that the Bush administration heavily slanted in their favour.

Are there any recent historic precedents of such a disconnect, in which double-digit national economic growth was not accompanied by any improvement whatsoever for the average American? Was it this bad under Reagan, or Thatcher?

Pondering these numbers, Drum approvingly quotes an article by Joe Klein on Time’s blog Swampland: “We have had 30 years of class warfare, in which the wealthy strip-mined the middle class.” He adds:

For three decades we’ve artificially kept middle class wage increases far below the growth rate of the economy, and this trend has been even more pronounced over the past eight years. This has created an enormous pool of extra money that’s been — yes — strip mined and redirected to the rich, and fixing this is Barack Obama’s biggest and longest-term challenge.

If we restore the normal growth of middle class wages, it provides a sustainable consumer base for the entire economy; it reduces the demand for endless credit card debt; it brings down income inequality naturally; and it goes a long way toward keeping the financial sector under control and reining in Wall Street salaries without putting in place a bunch of artificial (and probably fruitless) regulations. [..] Stop the strip mining and economic vigor will follow. It’s at the core of everything.

UPDATE: Lane Kenworthy, a Professor of Sociology and Political Science at the University of Arizona, had a blog post earlier this month that traces the trend further back, to the Reagan era: Slow Income Growth for Middle America (h/t to A2K user Hawkeye). The pattern is pretty devastating – and he’s got a telling graph too:

Continue Reading »

4 Comments

The ups and downs of the ground game campaigns: “We’re votin’ for the n***er!”

Debates, International Politics, Politics, Presidential Elections, Uncategorized, US Economy, US Elections, US Politics

Alex Massie featured an encouraging dispatch from a Democratic operative in Ohio last Wednesday: The Ground Game: The View From Ohio. It’s impressive stuff:

I got placed in Bowling Green, right by Bowling Green State University. [..] The county is a swing county, but that is mostly because there are 50,000 rural families and 25,000 Bowling Green residents combined with 25,000 Bowling Green students. [..] No candidate has carried Ohio without carrying Wood County (BG is the county seat). One would think that this historical oddity would almost mandate a heavy McCain presence, but alas there is none to speak of.

I spent a little bit of time at the Obama state HQ in Columbus yesterday. It was jaw dropping. They had taken over an old mega-church. The first floor was a warren of staffers running around all very young and all very busy. The basement was probably the size of a supermarket, lined with table after table. Each table was staffed by four youngsters, all responsible for a different city, county, task etc. It looked like the command center for a massive army. No windows, no natural light, but filled with kids who probably had no idea it was 8am all hovering over computers, maps, data sheets. There were 600 staffers there, all dedicated to Ohio, at 8am. I’m amazed.

Phonebanking for Obama

Volunteers phonebanking in San Francisco (Images used under CC license from Flickr user SanFranAnnie)

In another recent dispatch from the trail, the Denver Post emphasised the mindboggling extent to which the ground games of both campaigns are driven by sophisticated micro-targeting:

Continue Reading »

Comments Off on The ups and downs of the ground game campaigns: “We’re votin’ for the n***er!”
« Older Posts
Newer Posts »