Browsing the archives for the opinion polls tag.

Hungary: polling update and by-election preview (updated with results)

European Politics, International Politics, Politics

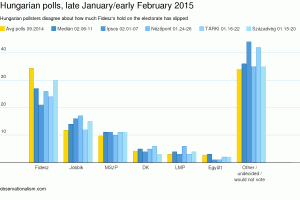
The Hungarian pollsters have been disagreeing about how much the grip which Viktor Orban’s governing party Fidesz has on the Hungarian electorate has been slipping. Things surely aren’t looking as favourable for them as, say, half a year ago, for a number of reasons. One has to keep in mind, however, that Fidesz enjoyed quite a boost after its national election victory last April, when it went on to win big in European and municipal elections later in the year as well. So to some extent we’re merely seeing a return to the already impressive level of support it enjoyed in those April elections.
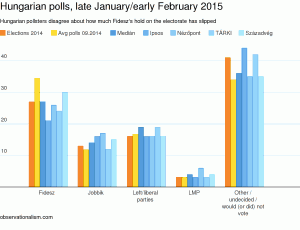
Chart: Hungarian polls, late January/early February 2015

Chart: Hungarian polls, late January/early February 2015 (click to enlarge)

Chart: Hungarian polls, late January/early February 2015

Chart: Hungarian polls; grouping together the left-liberal parties that ran a joint "Unity" list in last year's national elections (click to enlarge)

Fidesz’s current two-thirds parliamentary majority is in question with by-elections taking place in Veszprém two days from now. The district includes both Veszprém itself, a relatively prosperous town in Western Hungary, and some surrounding countryside, and outgoing MP Tibor Navracsics (now European Commissioner) won the seat easily last year, so it’s not the easiest place for the opposition to launch a challenge. If it does win the seat, however, Fidesz could theoretically be prevented from adopting further, hard-to-overturn “cardinal laws,” which require a two-thirds majority – though that presumes that the MPs from the center-left parties and the far-right Jobbik are able of voting in unison against the government. Even if Fidesz will hold on in Veszprém (and it’s still favoured to do so), it will face the same challenge all over again in parliamentary by-elections in a district centred on nearby Tapolca in April.

In its infinite wisdom, the left-liberal opposition parties are supporting a “free-market evangelist” as their joint candidate, Zoltán Kész. The hard-right Hír TV station has dug up not all that old blog posts and social media comments in which Kész advocated privatizing health care and primary education and even making voting rights conditional on tax payments. That’s the Hungarian “left” — the same left which hurried to distance itself from Alexis Tsipras in the aftermath of Syriza’s election victory in Greece — proving once again that it is anything but. It did, after all, also eventually embrace Lajos Bokros, known best for the 1990s “Bokros package” of massive budget cuts, in the Budapest mayoral elections. The Green LMP is the only party on the left which is refusing to support Kész, whom András Schiffer called the candidate of the “pseudo-Left”.

Having said that, the government does seem somewhat worried, jumping in late last year to quickly direct a special, 2.5 million Euro grant toward Veszprém. Although Fidesz easily dispatched all opposition forces in last October’s local elections, at least outside Budapest, it hasn’t been lucky in local by-elections since. Eva S. Balogh summarizes the story on those, with left-liberal opposition voters apparently even showing some readiness to swing behind candidates of the far-right Jobbik if that’s what it took to oust a Fidesz councillor. The seemingly only opinion poll to be held in the Veszprém district saw a close race, with Fidesz candidate Lajos Némedi only narrowly leading Kész by 43% to 37%, and even that only thanks to the rural parts of the district, while Kész led in the city itself.

Despite his libertarian views, I hope Kész wins, and Veszprém might be a liberal enough town for him to stand a chance. This is no way for the opposition to rebuild a national election-winning force though. Hungarians have arguably voted out the parties most associated with budget cuts, privatizations and market-friendly reforms almost every single time since 1994, ever again believing the then-opposition’s (deceptive) promises that they would govern more socially. They brought back the socialists from the dead in 1994, then voted in Fidesz in 1998 when those socialists turned out to be more neoliberal than even the previous conservative government. They kicked Fidesz out again in 2002 in favour of the newly-populist Socialists, and reelected those in 2006 after they’d gone on a rather irresponsible spending spree. In 2010, after four years of Gyurcsany and Bajnai pursuing austerity, they dealt the Socialists a massive defeat in favour of Fidesz, and last year they reaffirmed their support for Fidesz and its national-populist rhetoric of resistance against the EU’s and IMF’s economic prescriptions. And yet the left-liberal parties that aim to bring Fidesz down now seem to be going out of their way to look like the local representative of Brussels, business and banks. In the process, they are leaving the far-right Jobbik to sweep up the votes of the increasing numbers of disgruntled middle- and lower-income voters who are disappointed with the arrogance and corruption of Orban-ocracy but poor enough to have faced the wrong end of the free market.

The center-left opposition should perhaps instead take heed of a recent poll which revealed that Jobbik is now the largest party among those younger than 30. That’s scary. To fight that trend, it’s time for the left, such as it is, to show that its primary concern is with the struggle many poor, working class and lower-middle class Hungarians are waging to get by. I’m not sure that identifying itself with the likes of Kész and Bokros is going to help with that.

Update: Opposition candidate Zoltán Kész won, and with a surprisingly comfortable margin, 42,6% against the Fidesz candidate’s 33.8%, the Jobbik candidate’s 14.1%, and the LMP’s 4.6% (the remainder went mostly to independent candidates). That’s a striking contrast with last year’s results, when Navracsics got 47.2%, the center-left’s joint candidate 27.6%, the Jobbik candidate 16.5% and the LMP candidate 6.2%. Turnout was 45%, which is lower than last year’s 64% but high for a by-election. Christopher Adam at Hungarian Free Press has more info. Worth noting: somebody on Twitter mentioned that the 8 o’clock news broadcast on national public TV mentioned nothing about the election result, even though some 80% of the votes had by then already been counted, and it was clear that Fidesz was losing.
1 Comment

Greece, elections 2015: How did the pollsters fare? Not too shabbily

European Politics, International Politics, Politics

In the aftermath of the momentous Greek elections, this seems worth mentioning: the Greek exit polls were fairly close to the mark, and the last pre-election polls approached the actual election results almost as closely as the exit polls.*

The latter, especially, seems impressive, not least because their performance was hardly a given. Ahead of the May 2012 elections, the pollsters entirely failed to capture the dynamic of the electorate. (Admittedly, it’s not easy to poll a watershed election which all but broke up the entire Greek party system, and they did approach the results of the June 2012 elections much more closely.)

The 2015 elections: how the pollsters did

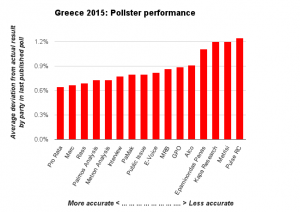
Chart: Greece 2015 elections: Pollster performance

Click to enlarge: How closely did the last pre-election polls approach the actual election results?

This time, a Pro Rata poll which was in the field 5-6 days before the elections pegged the numbers closely enough to the actual results that it was off by an average of just 0.6% by party. Even the “worst” poll was only off by an average of 1.2% by party.

Interestingly though, to the extent that the polls in the last few days before the elections did miss the mark, there was a distinct pattern. When you calculate the average of each pollster’s final poll, it turns out to have understimated every anti-bailout party, whether on the left or right (Syriza, XA, KKE, ANEL), and overestimated every pro-bailout party on both the left and right (ND, Potami, PASOK, KIDISO). Sometimes the deviations were tiny (like a tenth of a percentage point), but it’s still a striking pattern.

In particular, the average of the final polls had the incumbent government party, New Democracy, 1.8% higher than the share of the vote it eventually received, while it had the Independent Greeks 1.1% lower.

For more data and information, read on below the fold.

Continue Reading »

Comments Off on Greece, elections 2015: How did the pollsters fare? Not too shabbily

Polling: The short, sharp election campaign in Greece led to surprisingly small, but significant changes

European Politics, International Politics, Politics

It’s election day in Greece and the campaign will have been one of the shortest Europe’s seen in some while: it’s just 27 days ago, on 29 December, that parliament failed to elect a new president in the last of three votes, which triggered these new elections. Politicians scrambled to launch their campaigns, and former Prime Minister George Papandreou even still quickly founded a new party. “Few election campaigns have been as bitter or polarised as this,” the Guardian reported. And yet, all the sound and fury caused remarkably small changes in political preferences.

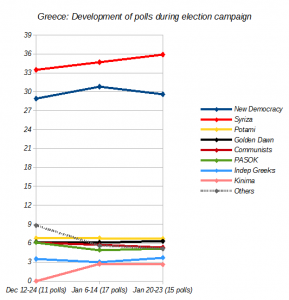
In particular, with all eyes trained on two main parties fighting for high stakes, you might expect the electorate to gravitate towards them, abandoning smaller parties that get neglected in the media coverage. This would seem especially likely in Greece because of the quirk in its election system, which awards the largest party a bonus 50 seats, making sure it will at least get close to a parliamentary majority. Some of this trend did indeed play out in Greece, but more so in the months prior to the election campaign. Over the second half of last year, both the governing New Democracy party and main opposition party Syriza steadily won over ever more voters, taking Syriza from 29% to over 33% and New Democracy from 24% to 29%. At some point Syriza’s average lead in the polls stretched out to almost 7%, then it shrank again to just over 4%. But by the time the actual election campaign rolled around, despite polls showing a large share of the population still undecided, their respective positions and those of most of the smaller parties evened out. That’s illustrated in this table, which shows a polling average drawn from the most recent poll from each pollster within the given time period:*


Dec 12-24
(11 polls)
Jan 20-23
(15 polls)
New Democracy 28,9 29,6 0,7
Syriza 33,5 35,9 2,4
Potami 6,8 6,7 -0,1
Golden Dawn 6,2 6,3 0,1
Communists 6,1 5,3 -0,8
PASOK 6,1 5,1 -1
Indep Greeks 3,5 3,7 0,2
Kinima 0 2,6 2,6
Others 8,8 5,1 -3,7

* If a pollster published two polls within the period, only the last one is counted; dates reflect the mid-point of when the polls were being conducted where available, not the day of publication.

Syriza netted another 2.4%, which is a decent achievement in the light of the government’s attempts to instill fear and panic over a possible Syriza take-over, but no sea change. Papandreou’s new party didn’t make much of a dent, stalling at 2.6%. The very smallest parties, those which polled under the system’s three percent electoral threshold, lost a lot of ground, but all the other remained roughly stable, with only the communist KKE and the center-left PASOK party losing a percentage point.

In the interest of polling hygiene, you may want to compare only those polls which were in the field during both time periods, in order to avoid the difference between the two periods reflecting ‘house effects’ of the pollsters rather than actual changes in public opinion. The data are very similar though:


Dec 12-24
(11 polls)
Jan 20-23
(11 polls)
ND 28,9 29,4 0,5
Syriza 33,5 36,1 2,6
Potami 6,8 6,8 0,0
Golden Dawn 6,2 6,3 0,1
KKE 6,1 5,3 -0,8
PASOK 6,1 5,0 -1,1
Indep Greeks 3,5 3,7 0,2
Kinima 0,0 2,6 2,6
Others 8,8 5,1 -3,7

That doesn’t mean there weren’t some interesting dynamics during the campaign though. In fact, it seems to have reached a tipping point about half way through. Here’s the same data as above, including all pollsters, but for three different periods, including a time period mid-way during the campaign:


Dec 12-24
(11 polls)
Jan 6-14
(17 polls)

Jan 20-23
(15 polls)
New Democracy 28,9 30,8 1,9 29,6 -1,2
Syriza 33,5 34,7 1,2 35,9 1,2
Potami 6,8 6,8 0,0 6,7 -0,1
Golden Dawn 6,2 6,1 -0,1 6,3 0,2
Communists 6,1 5,7 -0,4 5,3 -0,4
PASOK 6,1 4,9 -1,2 5,1 0,2
Indep Greeks 3,5 3,0 -0,5 3,7 0,7
Kinima 0 2,7 2,7 2,6 -0,1
Others 8,8 5,6 -3,2 5,1 -0,5

Here’s the chart to that latest set of data – click to enlarge.

Greece election polls chart

The polling average from three periods: the two weeks before the election campaign started; an eight-day window halfway through the campaign; and the last four days of polling.

In the first week or two of the campaign, we still see a continuation of the trend from the previous half a year: both New Democracy and Syriza gain some additional ground, at the expense of especially the “others” category of smallest parties. In addition, the emergence of Papandreou’s splinter party predictably hurt his old party, PASOK.

But in the last week or two of the campaign, New Democracy suddenly started slipping away, first almost imperceptibly, and with greater urgency the closer the elections came. In the couple of days, four different pollsters have seen ND numbers that are 2-4% lower than they were earlier this month. Syriza, on the other hand, kept on its incremental growth, and now its average lead in the polls is back up to over 6%. The Independent Greeks, a right-wing, anti-bailout party, seemed to benefit as well, rebounding a bit from its perilous position near the threshold line.

Narrowing the selection of polls down to only those pollsters which were in the field during each of these three periods doesn’t change much about the pattern:


Dec 12-24
(11 polls)
Jan 6-14
(11 polls)

Jan 20-23
(11 polls)

ND 28,9 30,8 1,9 29,4 -1,4
Syriza 33,5 34,7 1,2 36,1 1,4
Potami 6,8 6,8 0,0 6,8 0,0
Golden Dawn 6,2 6,1 -0,1 6,3 0,2
KKE 6,1 5,7 -0,4 5,3 -0,4
PASOK 6,1 4,9 -1,2 5,0 0,1
Indep Greeks 3,5 3,0 -0,5 3,7 0,7
Kinima 0 2,7 2,7 2,6 -0,1
Others 8,8 5,6 -3,2 5,1 -0,5

Now, all we can do is wait until the polling stations close and we can see how far off the polls might have been!

Comments Off on Polling: The short, sharp election campaign in Greece led to surprisingly small, but significant changes

Greece, ten days before the elections: Based on an average of the most recent polls, Syriza would fall just six seats short of a parliamentary majority

European Politics, International Politics, Politics

The polling

  • Wikipedia has a seemingly exhaustive list of opinion polls, which appears to be updated every day or almost every day. The numbers there have been recalculated where necessary to exclude any “undecided” or “would not vote” percentage, so the totals of each poll add up to 100%.
  • As of tonight, there have been a staggering 17 polls by 15 different pollsters in the last week (Alco and Rass both published two). Taking the average of the most recent poll from each pollster (i.e. excluding the older of the two polls by Alco and Rass), Syriza gets an average 34.8% of the vote, New Democracy gets 30.4%; see the spreadsheet linked below.

The system

  • The Greek electoral system, based on proportional representation, is marked by two peculiarities. The first is an electoral threshold of 3%; any party getting less than that gets no seats. The second is that the party with the greatest number of votes gets a bonus 50 seats, with the aim of increasing political stability. (The only other example I can think of that follows this model is how one of Italy’s two houses of parliament was elected in the past decade.) In total the Greek parliament has 300 seats, so for a governing majority you need 151.
  • Right now, according to the average of recent polls, almost 9% of Greeks would vote for parties that are set to miss the 3% threshold. Those includes the newly launched outfit of former Prime Minister George Papandreou, To Kinima, which is polling at an average of 2.7%, and Dimar, which has declined so much it’s usually not listed separately in polling results anymore. This means that the 250 parliamentary seats that are allocated proportionally are divided up based on the votes of about 91% of the electorate.

    For 9% of Greek voters to miss out on parliamentary representation would be a shame, but it would hardly be unprecedented; in the May 2012 elections, an astonishing 18% of them voted for minor parties that got less than 3% each. (They wizened up in the elections two months later though, when just 6% did.)

The spreadsheet

Here it is – or go and see it at a more comfortable size:

Top of the sheet: current average polling for each party; and prospective number of seats for each party, taking into account the 3% threshold and 50-seat bonus.

Underneath: the results from each recent poll, from Wikipedia.

Syriza’s prospects

Just six seats from a majority sounds good for Syriza. But it’s not entirely as good as it may seem:

  • The party would still need to get those six additional seats to get to a parliamentary majority, and there doesn’t seem to be an ample choice of partners.

    Greek politics is divided both between left and right and between those who support and oppose the bailout packages and accompanying austerity policies. As supporters of the bailout packages, long-time former rivals ND and PASOK found each other in the incumbent government, which was already something of an emergency alliance (and all but killed PASOK electorally). For opponents of the bailout policies on the left and right to find each other in a similar way would be even harder, since they are posited on the respective flanks of the political system.

    On the left, there is Syriza and the communists; on the right, the Independent Greeks and the fascists. The fascists are beyond the pale for anyone. The communists, however, if I understand things correctly, aren’t particularly useful either. Stuck in the 1950s, they’re the fully unreconstructed type, best at home in issuing declarative statements in the wooden language of the Soviet era, while waiting for the revolution to come. They might not prove reliable partners in government. An alliance with the populist conservatives of the Independent Greeks seems like a wildcard option, since they do share Syriza’s anti-bailout, anti-austerity stance, but they’re on the brink of failing to meet the 3% threshold.

    The alternative is finding allies among the center-left parties PASOK and To Potami (“The River”). The latter party, a center-left outfit headed by a famous TV personality, has apparently teamed up with the pro-business DRASI party, which doesn’t bode well for collaboration in an anti-bailout program. And PASOK politicians would have to make a complete turn-about from their current collaboration in the ND-led government.

  • A few percent change here and there could change everything.

    Syriza’s lead over ND has eroded from around 7% in October/November to just over 4% now. It seems to have stabilized over the past two weeks, but it’s not a safe lead. Ahead of the May 2012 elections, polls were wildly off, starkly overstating support for the “old” parties ND, PASOK and KKE and equally understating support for the insurgent Syriza and Golden Dawn. In the June 2012 elections, the polls did a lot better, but had ND and Syriza tied going into the elections when ND ended up winning by 3%.

    If To Kinima does pass the 3% threshold, this would take away seats from all the other parties, including Syriza, and make the 251 seats harder to get to. Vice versa, if the Independent Greeks would fail the threshold, this would scatter its seats across the other parties, bringing Syriza 3 seats closer to a majority, but deprive it of a potential ally on certain issues.

Comments Off on Greece, ten days before the elections: Based on an average of the most recent polls, Syriza would fall just six seats short of a parliamentary majority

Polling the stimulus

Economy, Politics, US Economy, US Politics

You may have seen Karl Rove opine in the WSJ that “support for the stimulus bill is falling”, and that “the more Americans learn about the bill, the less they like it.” He is certainly not the only conservative asserting that the bill is impopular.

I’m not in the super-enthusiastic category myself, if obviously for very different reasons than conservatives have for disliking it. Overall I think the bill doesn’t look bad, though my initial enthusiasm has been damped somewhat after reading, for example, Paul Krugman’s very persuasive commentary. It’s probably not enough, and maddeningly worse than it could have been; but it’s still a whole lot better than nothing, and it does have lots of good stuff in it. So far my layman’s take, which is not exactly the most interesting one.

But what does the American population think? Is Karl Rove right? Unsurprisingly, not quite. An overview of the polls that were conducted in the past two and a half weeks, and explicitly asked respondents to express an opinion for or against the bill.

There are two pollsters that have done more than one poll within this timeframe: Gallup and Rasmussen.

Gallup asked: “As you may know, Congress is considering a new economic stimulus package of at least 800 billion dollars. Do you favor or oppose Congress passing this legislation?” All three times it polled the question, it found a majority in favor, and in the last iteration, on the 10th, that majority had grown from 52% to 59%.

Rasmussen asked: “Do you favor or oppose the economic recovery package proposed by Barack Obama and the Congressional Democrats?” It found strikingly different results.

According to Rasmussen, in late January a narrow plurality of 42% was in favour; a week later the roles were reversed, with a plurality of 43% in opposition; and by the 11th a plurality of 44% was in favour again.

Three other pollsters asked a variation of the same question at some point in these last two and a half weeks.

A CBS poll queried respondents: “Would you approve or disapprove of the federal government passing an economic stimulus bill costing more than 800 billion dollars in order to try to help the economy?” They approved by 51% to 39%.

A Pew poll asked respondents: “From what you’ve read and heard, do you think [the economic stimulus plan being proposed by President Obama that may cost about $800 billion] is a good idea or a bad idea?”. It found a narrow majority of 51% saying it was a good idea; 34% thought it was a bad idea.

Continue Reading »

1 Comment

Will the grapes of the House GOP’s wrath turn out to be sweet for the Democrats?

Culture, Politics, US culture, US Economy, US Politics

I already noted that the significant dilution of the stimulus bill, when it was only going to be rejected unanimously by the House GOP anyway, drove some people up the wall. “Now that [Obama has] offered concrete concessions to the GOP only to have them publicly throw them back in his face, there simply isn’t any super-secret strategy that can [..] make it all make sense,” wrote Stephen Suh angrily at Cogitamus. Why bother even striving for compromise?

This question will get more acute by the day, as a recent post by Kevin Drum illustrates. He reports on the Obama administration’s push to extend the February 17 deadline for TV stations to switch from analog to digital transmissions. Not exactly a hotly partisan issue, right? The Senate promptly arrived at a bipartisan bill – which it passed unanimously. Every Republican agreed. But then the bill went to the House.

Only 22 House Republicans voted in favour. 155 voted against it. Drum: “100% of Senate Republicans voted in favor but 90% of House Republicans voted against. Shazam! Apparently the House GOP caucus really has decided to blindly stonewall everything Obama wants, no matter what.” He posits: “This is even more of a wakeup call than the vote on the stimulus bill.”

Right. The House GOP leadership is startlingly open about its intentions too, observes Dan at Bleakonomy. It will block and obstruct whatever comes its way, so Republicans can freely blame the Democrats for everything when the economy hasn’t recovered yet in six months. Yes, six months – if things haven’t improved in six months, the Republicans intend to say that it’s all the Dems’ fault and that the stimulus “didn’t work” because they “didn’t have the input in this”.

Of course, the current crisis is turning out to be the worst in almost three decades and is guaranteed to have an impact lasting (much) longer than six months, so … GOP profit!

Yet still there are valid reasons not to come down on Stephen’s side of the argument … yet. (I mean, apart from the stimulus bill not actually being all that bad.) The obvious one is the enormous contrast between House and Senate Republicans on the TV bill. If the Senate GOP shows any remotely similar divergence from the House Republicans’ obstruction course on the stimulus as well, Obama’s strategy may still come to “make sense”.

Then there’s the question of strategy. I already linked to Josh Marshall’s argument that offering the Republicans significant compromises, only for them to reject everything anyway, will help to brand them as the party of ‘no’. Which will marginalise them even further in 2010 so the Dems can go the long haul. Kevin Drum links to more evidence on that count too: a poll conducted by Democracy Corps on January 14-19.

Continue Reading »

1 Comment

Obama’s polling compared to Kerry’s, Gore’s and Clinton’s – final day update

Politics, Presidential Elections, US Elections, US Politics

My comparison from a week and a half ago of how Obama’s polling numbers match up with Kerry’s polling in 2004, Gore’s in 2000 and Clinton’s in 1996 has surprisingly become the most visited page on this blog since. Considering the interest, I thought it would be good to provide a last-day update on how the comparison is shaping up at the end of the campaign.

There are four daily tracking polls this year that also conducted daily tracking polls in either 2000 or 2004 or both. The comparison between the races shapes up differently depending on which pollster’s numbers you look at. The best known is Gallup, and this graph compares Obama’s performance versus McCain in the Gallup poll with Kerry’s, Gore’s and Clinton’s performance against their Republican opponents:

Gallup polling: Obama vs McCain in 08 compared with Kerrys, Gores and Clintons polling

Looking good indeed; the 11-point lead Gallup showed for Obama in its final presidential estimate last night is on par with its election-day polling lead for Bill Clinton in ’96. While Clinton’s ample lead gradually eroded over the course of the last two weeks of campaigning, Obama’s held steady. Quite the difference with the nailbiters the last Gallup polls out predicted for the 2000 and 2004 races.

TIPP is a polling firm you may not have heard of; it has conducted a daily tracking poll for the Investors Business Daily this year, and for IBD and the Christian Science Monitor in earlier years. Of the seven tracking polls that were conducted on a daily basis in the last two weeks, this poll has tended to show the smallest Obama leads of all. When McCain’s chief strategist Steve Schmidt asserted, two weeks ago, that “the McCain campaign is roughly in the position where Vice President Gore was running against President Bush,” the TIPP poll was the only poll that confirmed his assertion.

Today, however, brings good news for Obama supporters: after oscillating between a 1-point and 5-point lead for Obama for two weeks, TIPP published a final estimate last night that had Obama leading by 7.2%. And that makes the comparison over the years look like this:

Continue Reading »

Comments Off on Obama’s polling compared to Kerry’s, Gore’s and Clinton’s – final day update

Daily tracking polls update: “Looking OK now” edition

Politics, Presidential Elections, US Elections, US Politics
Tracking polls update, 31 October

Chart1: Daily tracking polls update, 31 October

Three days ago, I was feeling nervous about a sudden seeming lurch-let towards McCain in the daily tracking polls. This in spite of repeated posts by the experts insisting that there was no actually meaningful tightening going on, it was mostly just a question of statistical artifacts.

By this morning, Pollster.com’s status update did acknowledge that there had been some movement: “If you look at our national trend chart, we definitely show a narrower Obama margin now (5.4% as of this writing) than about a week ago.” Obama’s current national trend estimate, Mark Blumenthal explains, now stands about a point lower than his high of 50.9% a week ago, and McCain’s current estimate is slightly less than two percentage point higher than his low of 42.2% on October 12.

However, there’s still little to worry about, basically, as he points out the obvious to calm our nerves: “[T]ime is short and Obama’s lead still looks daunting. [..] Obama continues to lead on every national poll and yesterdays tracking updates show no decisive shift in either direction.”

Today’s tracking poll numbers certainly help sooth the jitters, as most actually show movement towards Obama (see Chart 1). Over the last two days, the ABC/WaPo, IBD/TIPP and Rasmussen daily trackers all have Obama’s lead back up 1 point, Zogby has it up 2, and the Gallup samples have moved back in Obama’s favour too: the regular voter and expanded likely voter samples both by 2 points and the traditional likely voter sample by no less than 5 (from 3% to 8%).

The result is that the average of all daily tracking polls has Obama’s lead back up by 1 point from +5.6% to +6.6%, after it had fallen by 2.7 points in the previous four days.

Continue Reading »

Comments Off on Daily tracking polls update: “Looking OK now” edition

Daily tracking polls update: the nervous edition

Politics, Presidential Elections, US Elections, US Politics

Is John McCain’s evil masterplan working?

I’m a bit confused about what masterplan, evil or otherwise, McCain would be implementing right now – I mean, ginning up a red scare about Obama the Socialist, really? But it wouldnt be the first time that a tack I considered wholly idiotic seems to work with American voters. (They sometimes work with Dutch voters too, for that matter – though probably not the red-baiting one.)

Either way, the daily tracking polls are showing some tightening of the race. Could be statistical noise, could be real. The movement would probably not be enough to decide the race either way, but still, the lowest estimates of Obama’s lead are getting disconcertingly close to zero:

  • Gallup has Obama’s lead down 3 points today, both in its expanded likely voter model (from 10% to 7%) and its traditional model (from 5% to a perilous 2%);
  • Rasmussen has Obama’s lead down 3 points in two days, from 8% to 5%;
  • Research 2000 has Obama’s lead down 4 points in two days, from 11% to 7%;
  • Zogby has Obama’s lead down a point today to just 4%, after it already fell from 10% to 5% the day before yesterday.
  • The IBD/TIPP poll is stubbornly stuck at a modest 3-4% Obama lead since the 22nd.

All in all, Obama’s average lead in the daily tracking polls has fallen from 8.3% three days ago to 6.0% tonight.

Chart 1: All daily tracking polls

Chart 1: All daily tracking polls

It should be said that there is one non-tracking poll that paints a seriously different picture. A Pew poll out today is showing a delirious 15-point lead for Obama among likely voters, with McCain down at just 38%. John Judis flagged that one (using the poll’s even more favourable numbers for registered voters) to tell us to “start popping the corks”.

The balance is evened out again, however, by the GWU Battleground tracking poll (which I dont include in the graphs because it’s not a daily tracking poll), which has Obama’s lead unchanged at just 3%. So count me in with his colleague Noam Scheiber, who is “still sweating” it.

For an overall picture of all national polls, check out …

Continue Reading »

3 Comments

McCain 2008 = Gore 2000? Matching the numbers from Gallup, ABC, TIPP and Zogby

Politics, Presidential Elections, US Elections, US Politics

A fair bit of attention has been paid in the blogs today to the assertion of McCain’s chief strategist Steve Schmidt that “The McCain campaign is roughly in the position where Vice President Gore was running against President Bush one week before the election of 2000.” It’s met a good dose of scepticism. The WaPo drily annotated the quote as follows:

McCain’s team dismisses the most dire polls — those showing the race nationally with a double-digit lead for Obama. Advisers believe the contest’s margin is in the five-to-seven-point range, about the same deficit, they say, that then-Vice President Al Gore faced at this time eight years ago against then-Gov. George W. Bush. (A Washington Post poll at the same point in the 2000 race showed a tie.)

NBC’s First Read similarly remarked:

[T]he NBC/WSJ poll right before the election found Bush ahead by three among likely voters (47%-44%). But our most recent poll shows Obama up [..] 11 points among likely voters (53%-42%).

In addition, Marc Ambinder points out that the margins are “way different” state-by-state: “Obama’s doing much better in 2008 than Al Gore was in 2000 in the battleground states.”

Now I had a graph up here a week or two ago charting how Obama’s current Gallup numbers compare with the lead or deficit that Kerry, Gore and Clinton faced in the previous three presidential elections. In the days since, Googlers have found this site through at least 27 permutations of searches involving some combination around Gore, Bush, polls, October, historical, 2000, elections, tracking and Gallup. So this is a good occasion to update that post and expand it, not just looking at the Gallup numbers but also those from the ABC, Zogby and TIPP daily tracking polls from 2000, 2004 and 2008.

First off, that chart from last time, based on the Gallup polling numbers from the last four elections. Here’s the update:

Continue Reading »

2 Comments

Too. Many. Daily tracking polls. Update, 22 October.

Politics, Presidential Elections, US Elections, US Politics

The last daily tracking polls update I posted was on 8 October. That’s a lot of daily tracking poll results ago. Yet the bottom line is that nothing much has changed since.

On 8 October, the three-day running average of the daily tracking polls had Obama in the lead by 7%. Today, it has him in the lead by 7.1%. And in the meantime the clock is ticking on, and the window of opportunity for McCain to still close the gap is rapidly closing (or has it already closed?).

One major thing has changed though: there are ever more of the damn things. Daily tracking polls I mean. It seems like no self-respecting pollster can do without one this year (and to think that Gallup didn’t even have one in 2004!).

In early October you already had the long-running Gallup and Rasmussen ones, the Research 2000 one (sponsored by the Daily Kos) and the poll sponsored by Hotline and the alcoholic drinks business Diageo, conducted by FD. Zogby and Reuters started their own on 7 October; Investors Business Daily and the pollster TIPP followed on 13 October, and as of last Monday, ABC and the Washington Post present one as well.

daily tracking polls

Chart 1: All daily tracking polls

If you’re keeping a graph and you were basing any kind of trendline on the average of all daily tracking polls, this – well – sucks. Because every new poll comes with its own house effect, deviating from the others in its own ways. Zogby, for example, started off showing a 2-point lead for Obama when Rasmussen, Gallup and R2000 had it at 8-11 points. Then, just as the Zogby poll had settled nearer to the average, the IBD/TIPP poll came on the market showing Obama in the lead by just 2 points, when the other pollsters had it at 4, 5, 6, 10 and 12 points, respectively. And just when Rasmussen, Zogby, IBD/TIPP and Hotline agreed on a 4-5 point Obama lead last Monday, the ABC/WaPo jumped in with its own tracking poll showing a 9-point lead.

Finally, there was Gallup, on 12 October, providing no longer just data for registered voters, but separate numbers for not just one, but two distinct “likely voter” samples as well, one encompassing a larger universe of voters than the other.

Seriously, you would be put off posting new graphs too.

Which of the three sets of Gallup numbers do you feature? How do you deal with how the ups and downs in your average reflect some new poll having been added into the mix as much as any genuine shift in the numbers? And how meaningful do any of the numbers still seem anyway, when on almost any given day the five-to-nine sets of numbers you’re looking at have Obama’s lead anywhere between 3 and 11 points? (And that’s just the daily tracking polls!)

Chart 1 above, if you click it to enlarge, shows how messy and, by implication, uncertain it all is. The pollsters are all over the map in pinpointing Obama’s lead. But saying that is also identifying the obvious commonality. Every one of the daily tracking polls has Obama in the lead, and that’s been true since 17 September, over a month ago.

How big is that lead though?

Continue Reading »

2 Comments

Instant debate polls uniformly positive for Obama

Debates, Politics, Presidential Elections, US Elections, US Politics

Hattip to Pollster.com for the links – see also see their post from the first presidential debate about the methodologies used by these pollsters for the instant debate polls.

CNN poll:

Poll: Debate watchers say Obama wins

CBS poll of uncommitted voters:

CBS Poll: Uncommitted Voters Say Obama Won Final Debate

Democracy Corps focus group:

Undecideds Laughing At, Not With, McCain

See also:

Decisive debate win reinforces momentum for Obama

Media Curves poll:

Debate results for the 3rd 2008 Presidential Debate

Survey USA poll (California):

Heavily Democratic California Again Sees Decisive Obama Win In 3rd Presidential Debate

The Time article on the Democracy Corps focus group conducted by Stan Greenberg neatly illustrates the extent to which these polls show devastating numbers for McCain, far beyond just the question of who won:

Continue Reading »

1 Comment
« Older Posts