Browsing the archives for the European Politics category.

Party preference and income levels in the districts of Budapest: Elections 2014

European Politics, International Politics, Politics

Despite its populist image, the governing Fidesz party is still very much a bourgeois party, at least in Budapest. Conversely, electoral support for the far-right Jobbik in Budapest tends to be stronger the poorer a neighbourhood is. On the other side of the political playing field, the five-party socialist/liberal opposition alliance had roughly equally strong (or weak) support in wealthier and poorer districts alike. But when those parties run separately, their support reveals very differing geographic patterns.

All of this is suggested by a series of scatter plots I created, which chart the results of Hungary’s general and European elections earlier this year in Budapest’s 23 districts against gross income per capita levels in those districts. Check out the Infogr.am embedded below the fold – although you might prefer to view it on the Infogr.am website itself, where the charts are square as they are supposed to be rather than rectangular – that’s just the format of this blog distorting them a little.

Two qualifications should be made beforehand, however:

  1. The electoral geography of Budapest, as it relates to income levels, does not necessarily follow the same logic as that of Hungary as a whole. For example, in the European elections at least, the Socialist Party (MSzP) did seem to do better in the poorer, working class districts of Budapest than in the more prosperous ones. But at the same time, the party’s results in Budapest as a whole were the best it received across the country, even though Budapest is also the most prosperous region of the country. The relation between Fidesz and Jobbik votes and income levels in Budapest also appear to be quite different from how they work out in some of the other regions.
  2. The fact that a party does best in the richest (or poorest) areas doesn’t necessarily mean it also does best among the richest (or poorest) voters. The United States is the classic example of this paradox: Democratic presidential candidates tend to do best in the most prosperous states (e.g. the Bos-Wash corridor and the West Coast) and worst in the poorest states (e.g. the Appalachians and the Deep South). But exit poll after exit poll has confirmed that, although the correlation is becoming weaker over time, the party does better among lower-income voters and worse among higher-income ones. However, since we’re dealing with data by city district rather than by whole states here, such a paradox should be less likely to occur.

(One more small-print disclaimer: for income data by district I’ve relied on the Hungarian Central Statistical Office’s data regarding “Gross income serving as basis of the personal income tax per permanent population”. But the comparison between districts works out a little differently if you use its numbers on “Gross income serving as basis of the personal income tax per tax-payer”. I decided not to do that because it doesn’t take the large and varying number of non-tax payers in a district into account, for example the unemployed – and what about pensioners? – and this makes some of the districts with the highest non-active rates, like the 8th, look better-off than they are. But choosing the indicator “per permanent population” has its own effects; if you’re surprised to see Újpest ranking higher on the income axis than Zugló, for example, this is why, because the district has a high percentage of employed, working-age population (whereas Zugló, I assume, has more pensioners). Districts 17, 19 (Kispest) and 21 (Csepel) would also rank noticably lower with the alternative indicator.)

Continue Reading »

Comments Off on Party preference and income levels in the districts of Budapest: Elections 2014

Last weekend’s elections in Brandenburg and Thüringen: some data

European Politics, International Politics, Politics

The populist right-wing Alliance for Germany (AfD) had a chance to repeat the success it enjoyed in state elections in Saxony two weeks ago in two state elections last Sunday, which both also took place in the former East-Germany. But in both Brandenburg and Thüringen, it went one better and got double-digit percentages. The AfD got 12% of the vote in Brandenburg (sometimes nicknamed “the small GDR”) and 10% in Thüringen.

Just like in Saxony, the AfD took votes from across the political spectrum, pollster Infratest Dimap revealed. In Thüringen, just like in Saxony, the Christian-Democratic CDU, Social-Democratic SPD and (ex-communist) Left Party all saw 5-6% of their 2009 voters switch to the AfD, while the liberal FDP and extreme-right NPD lost significantly larger shares of their electorates to the party.

On the bright side, the SPD in Brandenburg easily maintained their position as the state’s top party, though the Left Party, which had been their junior government coalition partner, lost a lot and booked its worst state elections result there since 1990. Nevertheless, just like last time, Brandenburg’s SPD is free to choose to govern with them or with the CDU; either combination would have a majority.

In Thüringen, weirdly, the SPD has the same luxury of being able to pick its coalition partner, even though they lost heavily and were left with just 12% of the vote. Both the CDU and the Left Party did well, cementing their positions at the top of the state’s party system, and they both want to govern – but neither of them can do it without the Social-Democrats. So it will either be a renewed CDU/SPD government, with a parliamentary majority of 1, or a Left Party/SPD/Green government, also with a parliamentary majority of 1.

The latter would of course be more ground-breaking and exciting, but oddly enough the three parties actually pooled less of the state vote (46.3%) than five years ago (52.1%), and obviously back then the Social-Democrats chickened out, even though they were promised the Prime Ministerial post by the (larger) Left Party. However, their chickening out last time round, and their stubborn refusal to express a preference for one or the other coalition option in this year’s campaign, led to them losing a fair amount of votes to the Left Party in these elections. So maybe they won’t do it again.

I won’t do a fully-fledged blog post, but I tweeted some interesting data I’ll collate them here:

Voter flows

  • The Left Party in Brandenburg lost 19 thousand voters to the AfD, which attracted some attention; in part because of the curiosity of a stridently left-wing party losing voters to a populist right-wing party, and that not being an isolated phenomenon either, with far-left losing votes to far-right parties elsewhere as well; and in part because the AfD seemed to go out of its way to fish for Left Party votes. But to keep this in perspective: the Left Party also lost a whopping 119 thousand voters – six times as many – to the non-voter camp.
  • Vice versa, the CDU in Brandenburg had a good night, overtaking the Left as the state’s second-largest party for the first time since 1999, but nevertheless also lost 19 thousand votes to the AfD, meaning that the CDU lost a larger share of its 2009 voters to the AfD than the Left Party did.
  • The
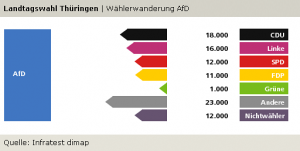
    Wählerwanderung, AfD: Thüringen

    Voter transfers to the AfD in Thüringen

    AfD in Thuringen also pulled votes from across the political spectrum, as this chart shows. (The “Andere” category here includes 10,000 votes the AfD pulled from the NPD.)
  • What these numbers mean is that the CDU lost 7% of its 2009 vote in Brandenburg, and 5% of its 2009 vote in Thüringen to the AfD; the Left Party lost 5% and 6%, respectively, of its 2009 vote in the two states to the AfD; and the FDP lost 14% and 12% of its vote, respectively, to the AfD. The SPD lost 6% of its 2009 vote in Thüringen to the AfD, but just 3% of its vote in Brandenburg.

Demographics:

  • More data on who voted for whom: In both Thüringen and Brandenburg, the AfD’s best professional groups were workers and the self-employed. And in both states, the Left Party did best among the unemployed and pensioners.
  • Here’s a worrying data point: for both the SPD and the Left Party, in both Brandenburg and Thüringen, the best age group was those over 60+. The fact that it’s true for both parties makes it all the more worrying about their long-term future in these East-German states. Meanwhile, the best age group for the AfD in both states was those between 25 and 34.

History:

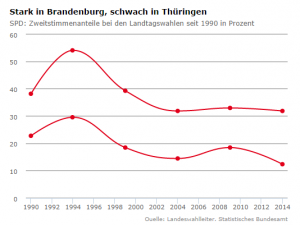
  • A historical perspective: the Left Party booked its best ever result in Thüringen … and its worst result since 1990 in Brandenburg. The SPD booked its worst result in the postcommunist era in Thüringen, and ex aequo (with 2004) the worst in Brandenburg. The Greens got their best result in Brandenburg since 1990, and the FDP its worst result there ever. Surprisingly, the FDP in Thüringen has seen worse times still (1.1% in 1999). The Spiegel has a couple of interactive charts to explore some of those historical trajectories, and here are screenshots for two of them:
  • Strong in Thüringen, weak in Brandenburg - Left Party state election results since 1990

    Strong in Thüringen, weak in Brandenburg - Left Party state election results since 1990

    Strong in Brandenburg, weak in Thüringen - SPD state election results since 1990

    Strong in Brandenburg, weak in Thüringen - SPD state election results since 1990

Comments Off on Last weekend’s elections in Brandenburg and Thüringen: some data

Charts! Last weekend’s elections in Saxony: Dresden, Leipzig and Chemnitz vs. the rest of the state

European Politics, International Politics, Politics

Last Sunday’s state elections in Saxony were marked by a low turnout, an only slightly eroded dominant position of the Christian-Democrats, and an imposing result for the right-wing, anti-system Alliance for Germany (AfD) party. The AfD was helped by the fact that these elections, the first state elections it ever took part in, took place in the very state where the party had already done best in the federal and European elections. Nevertheless, its 9.7% of the vote was remarkable and well beyond what the polls had foreseen.

Election night had its share of suspense as the extreme-right NPD hovered right around the 5% electoral threshold. It ended up missing it by a hair and getting 4.95%, which means it’ll be cast out of state parliament after ten years in its stronghold state.

There are several interesting geographic dimensions to the results, and I created an infographic at Infogr.am to share them. Below the fold, I accompany the Infogr.am charts with a few observations about what they show.

Continue Reading »

Comments Off on Charts! Last weekend’s elections in Saxony: Dresden, Leipzig and Chemnitz vs. the rest of the state

Of sideshows, curiosities and structural changes: Everything you ever wanted to know about this year’s local elections in the Netherlands (and probably quite a bit more)

European Politics, International Politics, Politics

Update: see also this post about the provincial elections of 2015 in the Netherlands – it has better maps and dives into some electoral history as well.

It’s not easy for local elections in a country the size of The Netherlands to make the international news. But if there’s anyone who can make it happen, it’s the peroxide-blonde leader of the Dutch far right Freedom Party, Geert Wilders. And that’s what he did, on March 19, when the municipal election results were being tallied.

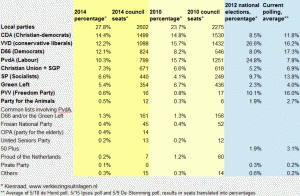
2014 Municipal election results, the Netherlands

Click to enlarge: 2014 municipal election results

Orating to a Freedom Party rally in The Hague, Wilders asked his supporters to give “a clear answer” to three questions that he was going to ask them; three questions that “defined our party”. “Do you want more or less European Union?”, he started off. Less, less, his supporters chanted enthusiastically. Second question: “Do you want more or less Labour Party?” Again, the crowd clapped and chanted: “less, less!”. So Wilders moved on to the third question. “I’m really not allowed to say this,” he started, but “freedom of expression is a great value … so I ask you, do you want more or fewer Moroccans, in this city and in the Netherlands?” The crowd, elated, chanted back: “Fewer, fewer, fewer!”, and with a sly little smile Wilders remarked, “then we’ll go and arrange that”.

Which got the Dutch election night headline space from the BBC to The Guardian, from the Times of Israel to Al-Jazeera, and from Fox News to the Huffington Post.

All of which was pretty unfair, considering that Wilders’ Freedom Party (or the PVV, as the Dutch call it) had been something of a non-entity in the whole local elections campaign. The party had refrained from taking part in the elections altogether in all but two municipalities: The Hague, the seat of the Dutch government, and Almere, a large town in Amsterdam’s commuter belt. Moreover, as was mentioned in almost none of these stories, it actually lost votes in both cities.

Continue Reading »

4 Comments

If Facebook ‘likes’ were votes, the far-right Jobbik would be the largest Hungarian party

European Politics, International Politics, Politics

Which Hungarian political parties use Facebook most successfully to create and engage with a significant online following? A comprehensive effort to find out reveals two things: the balance of forces between the Hungarian parties on Facebook is very different from what the actual results of the elections in April will be like – and despite what is basically a three-party system in real terms, there are a lot of Hungarian political parties with a Facebook presence.

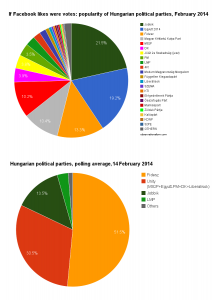
Facebook likes vs current polling for Hungarian parties

Facebook likes vs current polling for Hungarian parties

The chart on the right (click to enlarge etc., and yes, it’s a pie chart – but if that makes you twitch, there’s a bar chart further down this post) specifies the 22 parties with the largest numbers of fans. For comparison’s sake there’s a chart representing current opinion polling data underneath.

I’ve taken the concept of  “parties” in a light spirit and included the satirical Two-Tailed Dog Party (which once again has been denied registration, so it can’t take part in the elections this year), and it happens to blow many of the regular parties out of the water. (On that note, the Fourth Republic party 4K! probably also enjoys an unfair advantage, since it might now be seriously campaigning as an alternative left-wing party, but it used to be better known on Facebook for organizing things like an annual pillow-fight event.)

So who wins the Facebook races?

That would be the populist, far-right Jobbik party, best known for its rhetorics against “Gypsy crime” and recurrent bouts of anti-semitism. It is ‘liked’ by a whopping 188 thousand people on Facebook. Jobbik is especially strong among young voters, so its prominent showing on Facebook is no surprise, though the fact that it beats out all the other parties may be more of a shock. In the 2010 elections, Jobbik received 17% of the vote, and right now it’s polling at about 13%, so it’s a significant force in the real elections as well, but will remain deep in the shadows of the governing Fidesz-KDNP alliance in the elections.

Right behind Jobbik is Together 2014, the movement launched around former Prime Minister Gordon Bajnai, which for some time from late 2012 on roused the hopes of a center-left, liberal, pro-EU electorate for a strong new opposition force. The movement largely fizzled out though, and is now taking part as the largest junior partner in the five-party, left-of-center “Unity” opposition alliance under the leadership of the Socialist Party’s Attila Mesterházy. Together 2014 does almost as well as Jobbik on Facebook, which surprised me – but only in quantity of likes, not in actual engagement, as I’ll show below.

Third place is for Fidesz. All-powerful as it may be in the Hungarian state, government and, dare one say, economy (as well as current election polling), it doesn’t even get to play second fiddle on Facebook. Or does it? Fidesz may have ‘only’ 116 thousand or so likes, Prime Minister Viktor Orban has 219 thousand. Bajnai, in comparison, only has 103 thousand, and Jobbik’s Gábor Vona 155 thousand.

Coming in fourth is … no, still not the Socialist Party. It’s the Two-Tailed Dog Party, which promised such goodies as free beer, eternal life and “more of everything, less of nothing” in its previous abortive attempt at joining electoral politics. The Socialists only have 89 thousand likes – an unsurprisingly weak performance for a party best known for its legacy support among stubborn pensioners. Though Mesterházy himself does significantly better, with 152 thousand likes.

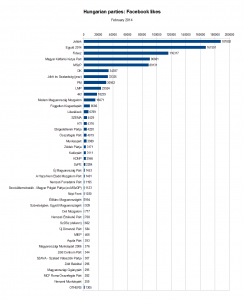
Chart: All Hungarian parties with more than 250 likes on Facebook

All Hungarian parties with more than 250 likes on Facebook

The rest of the parties follow at a respectful distance. The most popular of the lot include former Prime Minister Ferenc Gyurcsány’s Democratic Coalition, with 34 thousand likes (though his own page does much better, clocking in at almost 89 thousand) and the green party Politics Can Be Different (LMP), with 24 thousand.

The latter is outdone by two others though. The LMP broke up acrimoniously last year, and the break-away fraction formed “Dialogue for Hungary” (PM), which swiftly joined Together 2014 and, now, Unity. And on Facebook, PM easily surpasses LMP with 31 thousand likes. Even more surprisingly, both have fewer Facebook likes than the Welfare and Freedom Democratic Community (JESZ), which was founded upon the ashes of the once-important Hungarian Democratic Forum.

Honourable mentions go, not just to Fourth Republic, but also Lajos Bokros’s Modern Hungary Movement (16 thousand likes) and … the Independent Smallholders Party. They still exist! “Újra erősek vagyunk!”, We Are Strong Again, their posters exclaim somewhat optimistically, and hey – they do have more likes than any of the three liberal parties that emerged from the wreckage of the Alliance of Free Democrats. (Which reminds me: does Hungary really need six different green parties?)

The largest party, on Facebook at least, that I had never heard of is the Elégedetlenek Pártja, i.e. the Party of the Discontented. Which seems fitting. And if you think that the parties at the bottom of this second chart, which are mostly of the far-right, far-left, ecological and Romani varieties, are doing rather pathetically with just a couple of hundred likes, trust me – it can be much worse. After doing Facebook searches for every party I came across trawling through the Hungarian Wikipedia’s list of parties, the list of parties that registered a willingness to take part in the last elections and, last but not least, the decisions handed down by the National Elections Commission so far this year, I’ve found a total of 60, and the smallest one has just 13 likes. There are actually 15 different parties with fewer than 100 likes – don’t these people have friends and families to rope in? Here’s the full list – with URLs.

UPDATE: Active followers vs. disengagement and ‘fake’ likes

There are of course a lot of ways to artificially boost the numbers of likes for your page. Paying Facebook for ads is the simplest way. If you want to break the rules, you can also pay clickfarms for thousands of extra likes, though many of them might then come from South- or East-Asia. A friend pointed me to some evidence that a couple of Jobbik politicians took a more convoluted road. At least that’s what a blogger appeared to find out, when he followed a link to some clickbait story on a Hungarian site called DailyStory, was asked to ‘like’ the site to see the content, clicked ‘like’, and afterwards went back to his Facebook profile to erase the ‘like’ again. Turned out he hadn’t just liked anything from DailyStory, but instead the Facebook page of a Jobbik MP. A look at the page source of the DailyStory item confirmed that they’d actually pointed the ‘like’ to Mr. Lajos Kepli’s page, and some further digging revealed that the owners of DailyStory also own a site called “LikeMarket”. Looks like Mr. Kepli, and at least one other Jobbik politician, used that site’s services …

Does that mean that none of the numbers in this blog post can be trusted? Or that the Jobbik page’s numbers are probably bogus? I don’t think so, and not just because the revelations were only about a couple of individual politicians.

Of course it’s always good to be skeptical about page likes as stand-alone metric.  If you want to review an entity’s success in engaging supporters on Facebook more properly, you should look beyond those, for example at how many likes, shares and comments individual posts get, or how many people click on the links on the page. Since people who were tricked in liking a page or got paid for it by a clickfarm aren’t likely to start actively commenting on it, that also helps to weed out the fake “likes”. Of course all of that goes far beyond the scope of a blog post, but Facebook does provide a straightforward alternative metric: “Talking about this”.

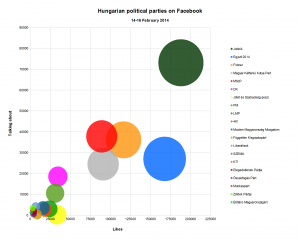
Likes versus 'Talking about it': engagement of Facebook followers

Likes versus 'Talking about it': how engaged are the FB followers of the different parties?

This metric measures how many people have, in the past week, commented on, shared or liked a post, joined an event, mentioned or checked in at a page, etc. Since it still includes new page likes too, it doesn’t wholly do away with the problem, but it helps. So how do the Hungarian political parties do when comparing total page likes and “people talking about this”? The chart’s on the right!

Turns out, Jobbik still rules the roost. Both in page likes and people ‘talking’ about their page. Their conversion rate of likes into actual engagement is actually better than most of the other parties are doing – suggesting no evidence of massive numbers of ‘fake’ likes distorting their top line number.

Instead, it’s Together 2014 which has a very low conversion rate, which is why it’s drooping towards the bottom right of the chart. Evidence that Together 2014 has fake likes? Not hardly, because many other things can explain such disengagement on the part of the ‘likers’ too. A feeling of resignation, for example, or disappointment. Together 2014 roused a fair bit of hope among center-left and liberal opposition supporters when it was launched – but a lot of those people are presumably not particularly enthusiastic by the new “Unity” alliance which Together 2014 has joined, led as it is by the Socialist Party and burdened by its inclusion of the very divisive politician Ferenc Gyurcsany and his Democratic Coalition.

Wholly anecdotically, I can say that 17 of my friends turn out to ‘like’ the Together 2014 page, more than any other party except the Two-Tailed Dog Party (which I guess tells you something about my friends) – and I know that many of them don’t trust Gyurcsany and/or the Socialists (who have a solid base but are perceived as corrupt, inept ex-communists even by many liberals and greens). There really doesn’t seem to be any enthusiasm about these elections – it’s all resignation about the inevitability of a Fidesz victory and the unattractiveness of the opposition.

It’s therefore interesting to see which other parties are showing higher or lower engagement rates among their Facebook followers. Higher than most? The Democratic Coalition and, to a lesser extent (roughly at a par with Jobbik), the Socialist Party. A sign that the old-fashioned polarization of the election campaign is rallying the base of the traditional left, at the same time (and for the same reasons) as it is depressing engagement among those who feel alienated from the old politics? Just like Together 2014, the green Politics Can Be Different party is doing weakly as well, burdened by last year’s split and its gloomy prospects of making it back into parliament.

Among the small parties, followers of Fodor’s Liberálisok do seem very engaged, and to some extent those of the KTI are too. Those of 4K!, many of whom probably came for pillow fights rather than politics, are not. The center-right JESZ, belying its relatively high number of page likes, is getting hardly any interaction at all – over 33 thousand likes, but just 205 people ‘talking about it’, that’s a horrible engagement rate. Then again I don’t think they’re taking part in the elections. Among the tiny parties, two itty-bitty green parties, the Zöldek Pártja and Élőlánc Magyarországért, have proportionally high ‘Talking About This’ numbers.

Age appeal

Finally, one thing is true for most of the political parties: people who ‘like’ a party are old, especially in the context of Facebook. As in: between 55 and 65 years of age. The notable exceptions are Jobbik, LMP, 4K! and, surprisingly, the KTI and Jesz. (Really? In combination with the horrible engagement rate, you’d almost think it’s JESZ which bought some likes …). Here are the numbers, according to Facebook, right now:

.

Party

Most pop. age group

.

Jobbik

18-24

.

Together 2014

55-64

.

Fidesz

35-44 / 55-64

.

Two-Tailed Dog Party

18-24

.

Socialist Party

55-64

.

Democratic Coalition

55-64

.

JESZ

18-24

.

PM

55-64

.

LMP

25-34

.

4K!

18-24

.

Modern Hungary Movement

55-64

.

Independent Smallholders

35-44 / 55-64

.

Liberals

55-64

.

SZEMA

55-64

.

KTI

18-24
Comments Off on If Facebook ‘likes’ were votes, the far-right Jobbik would be the largest Hungarian party

Ukraine: Did the protest movement transcend historical borders?

Culture, European culture(s), European Politics, International Politics, Politics

“Even in the president’s heartlands, in Eastern Ukraine, protesters have come out in strong support of ‘Euromaidan’,” two British academics argued last week on the Washington Post’s political science blog The Monkey Cage, and they drew a far-reaching conclusion: “In effect, Russophones and Ukrainophones, the East and West of the country, young and old, ethnic Russians and Ukrainians [have] united against – what they increasingly regard as – the illegitimate rule of the president and his party”.

A similar note was struck in a slideshare that’s circulating on Facebook, called What is really happening in Ukraine, which has been viewed over 650.000 times. Citing “massive protests” arising in the East and the South on January 26, the creators chide the Western press for a tendency to continue portraying the protests “in cold war terms,” as “fundamentally based on ‘ethnic/language’ splitting in Ukraine”.
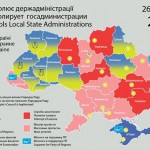
Ukraine, 26 January 2014: occupations, seizures and protests

Map of the situation in Ukraine, 26 January 2014, Sergii Gorbachov

Both arguments came with maps. The Monkey Cage contributors,  Kataryna Wolczuk and Roman Wolczuk,  presented a map from the Centre for Eastern Studies in Warsaw, which colours most of the country orange (“occupied state administration buildings”) or brown (“mass protests”). The slideshare used three of Sergii Gorbachov’s detailed maps, presenting the situation on January 25-27. On his map from January 26, 21:00, just two of the country’s provinces remained Yanukovych-blue: Donetsk and the Crimea. The rest of the country was in the grip of the revolution: local state administrations were “occupied by [the] people” or the object of “attempted seizures” or “mass protests”.
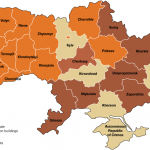
Ukraine, 29 January 2014: occupations and protests

Map of the situation in Ukraine, 29 January 2014, Centre for Eastern Studies

Those maps look very different from the one posted by Max Fischer in the Washington Post just a couple of days earlier, under the title “This is the one map you need to understand Ukraine’s crisis”. Fischer’s map of the regional divide running down the centre of Ukraine between the protesting North and West of the country and the non-protesting South and East neatly overlapped with those of various post-independence election results — and moreover, as I wrote and mapped out last week, with ancient and more recent historical borders as well. So did something fundamentally change, in the last two weeks?

Kataryna Wolczuk and Roman Wolczuk seem to believe so, when they go beyond describing the protests in the South and East as “unprecedented and until recently inconceivable” to describe “the East and West of the country” uniting against Yanukovych. The slideshare authors obviously also believe that analyses that still focus on ethnic/language divides are out of touch with the changing environment.

There are two questions about this argument: To what extent were they right, concerning the developments as they unfolded in the last days of January? And to what extent do any such changes last today?

Protesters in the East: How much of a force?

Poland’s Centre for Eastern Studies, which created the map used in the Monkey Cage blog post, summarized the state of the Ukrainian protests on January 29 in a detailed briefing, covering events across the country. When it came to developments in the South and East, it reported that “demonstrations numbering several thousand and blockades of offices also took place in Dnepropetrovsk, Zaporozhye, Odessa, Cherkassy and Lugansk.”

Map of Ukraine with main cities

Cities of Ukraine (Wikimedia)

By then the Centre had already published more detailed write-ups of ongoing events in the previous few days. Its briefing of the 27th cited “massive numbers of participants” in “protests in the largest cities of southern and eastern Ukraine”, which “reached unprecedented proportions”. Detailing the specifics, however, the briefing reported that “several thousand people” took part in an anti-government demonstration in Dnipropetrovsk, a “four-thousand-strong rally” was held in Sumy, a “demonstration of several hundred people” was dispersed in Zaporizhia, “2–3 thousand people” took to the streets in Odessa, “more than one thousand” people demonstrated in Kirovohrad, and so on. Reuters reported “up to 5,000 anti-government protesters” picketing the regional government  headquarters in Zaporizhia. The Centre for Eastern Studies’ briefing from a day later added a few details: “a one-thousand strong demonstration” was held in Luhansk, “which may be viewed as another sign of a civil ‘awakening’ of people in eastern Ukraine”; but meanwhile, in Kharkiv, Luhansk, Dnipropetrovsk and Zaporizhia “attempts at occupying administration buildings have been effectively and brutally countered by the police and groups of “titushky”‘.

Even if only a few thousand people took part in those various protests, that may indeed have been unprecedented; after all, in Luhansk for example, Yanukovych received over 80% of the vote in the last presidential elections. The local, Yanukovych-friendly administrations and oligarchs usually keep these cities on a tight reign. But does “several thousand” really equate with “massive,” let alone indicating that the East and the West are finally uniting against the current government? Kharkiv, Dnipropetrovsk and Odessa have a million inhabitants each; Zaporizhia has over 800,000. The same Reuters story reporting on the protest in Zaporizhia also interviewed an opposition journalist admitting that the local protests only attracted the educated middle class: “Unfortunately, Euromaidan’s appeal is very limited here”.

Not all these places are the same either. Sumy and Kirovohrad went for Tymoshenko over Yanukovych in the last elections, so it isn’t all that surprising that opposition protests would break out there. In fact, for two cities with 250,000-300,000 inhabitants which voted for Tymoshenko, a few thousand protesters doesn’t immediately impress, although Sumy protesters did occupy the city’s council building. The size of protests is also sometimes overstated – by both sides, for different reasons. A reporter from the Putin-critical Russian newspaper Novaya Gazeta observed a peaceful protest rally in Kharkiv where no attempts were made to storm the regional government building: “Most of the participants were students,” she said, “just half a thousand very young and unprepared kids who did not prepare for an assault at all”. Yet afterwards she saw on TV that an opposition politician was telling a Kyiv rally that “at this very moment protestors are blocking regional state administrations” in Kharkiv – and that the mayor of Kharkiv, from Yanukovych’s party, was threatening protesters that they shouldn’t involve themselves in a “war,” as they would be assured to lose it.

Violence and loathing on the streets

No doubt, the threat of violence and intimidation will have kept many away. Police used tear gas and smoke grenades, and “young men armed with baseball bats” attacked anti-government protesters in Kharkiv. In Zaporizhia,  men “with white ribbons on their shoulders were walking around the city and beating people”, a local journalist reported. The BBC linked to videos showing vigilante titushki, armed with seemingly identical batons, gathering inside a Dnipropetrovsk government building and then rushing out to viciously beat up demonstrators. The local Governor later called these men “representatives of the region’s public organisations”, calling “everything … perfectly legal.”

Vice versa, eighteen policemen were injured in Dnipropetrovsk alone, according to regional authorities. A blogger in Donetsk described “hired thugs” being transported in on buses to stage mock street riots and “imitate assaults at official buildings,” presumably “to frighten people here and … mobilize their voters,” but it’s not as if actual attacks on administrative buildings by anti-Yanukovych protesters have been lacking in graphical violence of their own, as this disturbing footage from a Central-Ukrainian city illustrated.

Anti-government protesters in Kharkiv and Dnipropetrovsk talked to France24 about their motivations on January 27th. “[I]n Kharkiv we’ve been having protests every day since November 22,” said Natalka Zubar – but it’s tough going. “Here in eastern Ukraine, [..] Russian TV is even more popular than Ukrainian TV, and every day its anchors talk about LGBT people controlling all of Europe, spreading sodomy, things like this. They claim all protesters are hooligans. But I think that more and more people have stopped listening.”
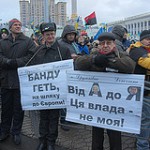
Protesters from Donetsk at Euromaidan

Protesters from Donetsk at Euromaidan in Kyiv (Photo by spoilt.exile, creative commons)

Protests in Dnipropetrovsk started two months ago, added Pavlo Khazan, and “there had been no major incidents [..] until Sunday”. That day, however, “some protesters decided that we should go to the regional administration building. [..] When we arrived, we were shocked to see that, behind a line of police officers guarding the building stood hooligans armed with sticks and baseball bats. The police let them attack us, and then dispersed the crowd [..] and began making arrests.”

The slideshare touting the protests’ strength makes mention of football fans several times. There’s a long history of politics and football mixing, and Ukraine offers a new episode. Local fans of Metalist Kharkiv and Dnipro Dnipropetrovsk protected demonstrators from attacks by aggressive pro-government groups, AFP reported on the 31st, along with even fans of Shakhtar Donetsk, in Yanukovych’s own hometown. “We came to support our people in fighting for their rights,” explained some of a group of about 60 Shakhtar fans in central Donetsk.

Already back in mid-January, professor Alexander J. Motyl wrote a piece extolling the bravery of anti-government protesters in Donetsk: “at first, it was only a small group of about 20 to 30 demonstrators who repeatedly assembled at the Shevchenko monument [..]. Then, a few weeks ago, several hundred brave protesters [..] carried pro-democracy, pro-Europe, and anti-Yanukovych banners in a march through downtown”. Motyl argued that even these small numbers had the local establishment spooked, and compared the demonstrations with Martin Luther King’s civil rights marches through Alabama: “For 500 marchers to assemble in Donetsk is the equivalent of 50,000 in Lviv or 500,000 in Kyiv.”

Is it? In symbolic terms, maybe. But not necessarily in terms of measuring the balance of public opinion across the regions.

Fathoming public opinion

The Ukrainian Center for Social and Marketing Research SOCIS last week released the results of a poll it conducted between 17 and 26 January. They don’t include any regional breakdown, but the overall results are instructive. The opposition is definitely on an upswing: Klitschko ‘s UDAR, the pro-Tymoshenko Fatherland party, Solidarity, and the far-right Freedom party are pooling some 58-60% of the vote among them in both parliamentary and presidential match-ups. That’s about 10% more than these parties received in the 2012 parliamentary elections. (The parties now rallying in the streets already actually received a narrow majority of the vote back then, but lost out big in seats because of their divisions.)

Support for Yanukovych’s Party of the Regions, however, has barely lessened. The party would get 29% of the vote in parliamentary elections, and he himself is polling at 29-30% in presidential match-ups. In 2012, the Party of the Regions received almost exactly the same share of the vote: 30%. Instead, it’s the Communist Party which lost some of its vote, polling at 8% when it received 13% in 2012, and the largest shifts are actually taking place within the opposition camp, with Fatherland (down to 20%) and Freedom (down to 7%) losing out to UDAR (up to 24%) and Solidarity (9%). In addition, some 30% of the full, initial sample answered that they wouldn’t know who to vote for.

Yanukovych’s party won the 2012 elections by racking up 65% of the vote in the Donetsk region, over 50% of the vote in Lugansk and the Crimea, and some 40% of the vote in the regions of Kharkiv, Zaporizhia, Odessa and Mykolaiv. And the Communists hauled in 18-25% of the vote in those same regions. If the Party of the Regions remains at strength and the Communists hold on to at least half of their vote, as this new poll suggests, then a majority of those who have an opinion in these regions are likely still in their camp. In the Dnipropetrovsk region, the Party of the Regions and the Communist Party pooled 55% of the vote in 2012 while Fatherland, UDAR and Freedom added up to 38%, so if shifts are taking place roughly proportionally around the country, that region too would at best be evenly divided now.

In the same poll, respondents were given a straight choice between entry into the EU and entry into a Customs Union with Russia, Belarus and Kazakhstan. A plurality of 43% chose for the EU, but 32% preferred the Customs Union (with the rest offering no answer), and that latter number will be proportionally higher in the East and South. These numbers suggest that little has actually changed. In openDemocracy, Valery Kalnysh recapped polling data from late December, when the Euromaidan protests were already ongoing but hadn’t yet escalated, and they showed that 50% of Ukrainians then supported Euromaidan while 42% did not, and that opponents were far in the majority in the East, by 65% to 30%. Tellingly, that poll had also shown support for not just the opposition leaders, but also Yanukovych going up since October, from 19% to 29% – suggesting that far from Yanukovych’s south-eastern base suffering erosion, the increasing polarization of the country was shoring it up. A whole series of polls by different pollsters between May and November 2013 had showed a similar balance of opinion, with support for EU access consistently at 41-47% and, with the one exception of a November poll, support for the Customs Union at 31-40%.

Rallying the counterforces: local authorities and the “titushki”
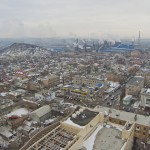
A view of Donetsk

A view of Donetsk (Photo by Vladimir Yaitskiy, creative commons)

In some regions, the mere prospect of increasing protest did seem to change some of the political dynamics. In Odessa, the Kyiv Post reported, the local administration and opposition struck a truce of sorts, a “non-aggression, mutual supportiveness deal”. But elsewhere  in the South and East, any challenge to the grip of Yanukovych loyalists seems to have been beaten back. On February 1, the Kyiv Post reported that local authorities in Dnipropetrovsk had detained two opposition party members for allegedly “plotting a terrorist attack at a national energy system facility”. In the Crimea, the regional parliament banned the Freedom party, though it was forced to reverse its decision on February 7. As January ended, one reporter found no more protests in Donetsk, just a middle-aged local scoffing: “Euromaidan? To hell with that!”. Organizers of a protest picket had cancelled it out of fear of further violence. Two local activists of the nationalist Freedom party had left Donetsk on the 27th, explaining that “we feared that emergency rule would be imposed so that nobody can leave the region”.

The regional deputy head of UDAR said that party activists throughout Donbass have been receiving threatening text messages on their mobile phones, and dismissed local pro-Yanukovych protesters as titushki, “hired thugs” and “former inmates”. An in-depth portrait of the “titushki” phenomenon for Foreign Policy describes these roaming groups of violent youths as an actually well-organized, 20,000-strong national force, complete with internal hierarchies, materially supported by riot police, and motivated by daily government pay-offs, Soviet and military-inspired loyalties to the state, ties to powerful organized crime groups with a vested interest in corrupt ruling politicians, and plain old criminal tempers.

Anton Davydchenko, the leader of a group called National Unity in Odessa which claims to have rallied over 1,000 volunteers, all ready to take up arms against anti-government protesters if necessary, would presumably recognize some of these descriptions and take issue with others. “We will never give them our cheek to be slapped. If they come to us with weapons, we will meet them with weapons,” he told RFE/RL. Like local authorities in Donetsk and Lugansk did with similar groups (described as including “Cossacks and Afghanistan war veterans”), local authorities are supporting the group.

Night over Kharkiv

Night over Kharkiv (Photo by Aleksandr Osipov, creative commons)

In Kharkiv, a conference of provincial Party of the Regions officials called for establishing a new organization called the “Ukrainian Front” – after the Soviet Army campaign that drove Nazi Germany out of Ukraine in WWII – at the suggestion of an Afghanistan veterans group. “‘The Front will purge and cleanse the Ukrainian land from anyone who has come here as an occupier,” orated the governor of Kharkiv: its participants “will follow their fathers’ and grandfathers’ example in freeing our lands, like in the 1940s”. (If that sounds alarming, it doesn’t help that many protesters in Kyiv have actually embraced the imagery of Stepan Bandera, who declared an independent Ukrainian State during WWII, and the  Ukrainian Insurgent Army (UPA), which committed war crimes and at times collaborated with Nazi Germany during its battle for independence.) Kharkiv’s eccentric mayor, Hennady Kernes, riffed on the same theme when approving of the local pro-Yankovych martial arts club Oplot, which has been accused of ties with the kidnapping and torture of Auto-Maidan leader Dmytro Bulatov: “I know these sportsmen,” he has said: “they are against allowing ‘Banderovtsy’ to come to Kharkiv and I support this”.
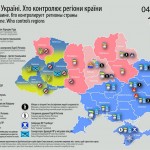
Protests in Ukraine - situation by region, February 4

Map of the situation in Ukraine, 4 February 2014, Sergii Gorbachov

All in all, the authorities in the South and East seem to have succeeded in beating back any challenge which local protesters posed to their position in late January. The last time Sergii Gorbachov posted an updated map was on February 4, and all the South and East had reverted back to Yanukovych-blue, with added icons indicating the appearance of pro-Yanukovych demonstrators, Party of Regions brigades and violent “titushki” as well as local protesters.

Change: up to moguls or mobs?

In the end, if the protest movement is to crack the South and East in a meaningful way, it may not be up to the protesters themselves. It will have to be up to elements in the political class itself — “and no one within that class is more powerful than Ukraine’s oligarchs, the billionaire business tycoons who together own a vastly disproportionate share of the country’s wealth,” as Sergii Leshchenko wrote in Foreign Policy. They won’t be motivated by political idealism, but by self-interest, needing the doors to the EU to stay open, stability to return to the country, and themselves not to be targeted by financial and visa sanctions to protect their wealth. Leshchenko recounts how a second oligarch, Viktor Pinchuk, switched to supporting the opposition in December – and he’s from Dnipropetrovsk.

The others, however, are still hedging their bets, at best – and it would have to be someone like Rinat Akhmetov, Ukraine’s richest man and still powerful in his native Donetsk, to really overturn the dynamics. Lesser moguls will not do, as two of the richest businessmen in Dnipropetrovsk found out after January 25. That day, Hennadiy Korban and Borys Filatov decided to air live broadcasts of the antigovernment protests in Kyiv on a large outdoor screen at a shopping mall they owned, and hoist the flags of the EU and Ukraine at their local properties. Hours later, the New York Times recounted, the electricity was suddenly cut to all their three shopping malls. Four days later, a local judge ordered “that Mr. Korban be detained and interrogated as a witness in connection with a previously dormant investigation of a 2012 murder”. Then, state security officers raided the premises of the businessmen’s accountant for “bombs or other evidence of terrorism”. The two men have now relocated to Israel.

Enduring divisions

With the iron grip of local authorities from Yanukovych’s camp in the South and East seemingly barely letting up, for now, and indications that a majority of the population there is still on the opposite side from Euromaidan’s activists (who themselves are hardly unified), the question arises how much future there is for a unitary state so bitterly divided. The dividing lines today are, after all, not very different from the borders of previous eras – could they become real borders of one kind of another again? The Ukrainian Communist Party has floated a trial balloon: Ukraine as federal state. Dividing Ukraine up into seven large states, each with its own parliament, would pull the country back from the brink of civil war and prevent the country from falling apart, the communists argue. But the opposition, not altogether without reason, is likely to see this as a mere Russian strategy to break up the state and seize the South and East.

Despite the initial enthusiasm about unprecedented demonstrations in the East illustrated by the Monkey Cage blog post, it seems in fact unlikely that “Russophones and Ukrainophones, the East and West of the country, [..] ethnic Russians and Ukrainians” will really unite against the political forces represented by Yanukovych any time soon. On February 4, a week after the small protests in the South and East crested, an AP report concluded that “two months into Ukraine’s anti-government protests, the two sides are only moving further apart. [The protesters] appear unable to significantly broaden their movement into parts of the country where the opposition is weak, as some of the protesters use nationalist rhetoric that alienates even liberal eastern Ukrainians.” As David Stern wrote in The Atlantic, even if Yanukovych does steps down, peacefully, and the opposition assumes power, “it too would not resolve Ukraine’s crisis. Political divisions, both within the country and the protest camp itself, will remain, and possibly become more pronounced” over time.
Comments Off on Ukraine: Did the protest movement transcend historical borders?

The geographical (and historical?) divisions underlying Ukraine’s political strife

European Politics, History, International Politics, Politics

As Washington Post blogger Max Fischer illustrated with what he called “the one map you need to understand Ukraine’s crisis”, the current protests and revolts in Ukraine are fierce, but largely limited to the north and west of the country, which is right in line with the pattern revealed in the 2010 election outcomes. It’s no secret that the same broad geographic divide appeared, time and again, in most of the elections since 1991, when Ukraine gained independence.

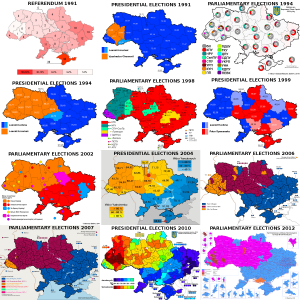
Ukrainian election maps, 1991-2012

Ukraine: Election maps for all the main elections since 1991

For convenience’s sake, I gathered electoral maps for all the presidential and parliamentary elections in those twenty years (as well as the 1991 independence referendum), in one big overview file. All of those maps are from Wikimedia/Wikipedia.

(One contestable editorial decision I made for the 2012 parliamentary elections was in choosing the map that showed the leaders in multi-member districts by constituency, rather than the one showing the leaders in single-mandate constituencies, which includes a lot of independents and is therefore less clear. I also couldn’t find a map of the results for Gorbachev’s All-Union referendum in 1991.)

Oddly, the candidates actually running for presidential office sometimes seemed irrelevant to the geographic divide itself. In 1991, the former dissident Viacheslav Chornovil was the worthy but politically weak candidate who won only in the Galician northwest of the country, while former apparatchik Leonid Kravchuk based his landslide victory on wide support in the south and east. But in 1995, the roles were reversed: Kravchuk won constituencies across the north and west when he lost his reelection bid against Leonid Kuchma, who swept the vote in the south and east. Those elections marked the first real time that the electoral map showed a dividing line right down the middle of the country that would start marking election maps again in every major election after 2002. But it gets stranger still: move on to 1999, when Kuchma faced a Communist Party candidate as opponent in his reelection bid — and it was Kuchma who won almost all of the north and west, while support for the communist candidate was based mostly in the south and east.

Considering Chornovil’s, Kravchuk’s and Tymoshenko’s losses, and the gritted teeth with which many voters in Kiev and the northeast must have voted for Kravchuk in ’94 and Kuchma in ’99, it’s hard to elide the thought that this pattern illustrates how the real political power in the country has lain in the south/east. The voters in the north/west have had to choose between voting for the lesser evil or rebelling in the streets. Yushchenko’s victory would be the only exception, and that took a revolution. I doubt that Viktor Yanukovich will ever switch to being the northwest’s candidate, though …

There is one further geographic wrinkle of note in these maps, and that is how the Transcarpathian/Ruthenian region constitutes a bit of an outlier within the northwestern half of the country. That’s the region midway on the left side, where the country’s borders take a turn east to curve around Romania, which is often coloured differently from all the surrounding territories. It can’t be a coincidence that the historical background of that region is wholly separate. Whereas the rest of northwestern Ukraine used to belong to the Polish-Lithuanian Commonwealth, and much of it to interbellum Poland as well, this region belonged to the Austro-Hungarian empire until WW1, and to Czechoslovakia between the two world wars.

When it comes to elections, history can be destiny. A map overlaying the borders between Imperial Russia and Imperial Germany on the Polish election results of 2007 has done the rounds online among map geeks for a few years because of the striking correspondence it reveals. And on a Reddit thread about these Ukrainian election maps, commenter Martin Keegan pointed out that “the boundary is where the old Polish-Lithuanian – Russian border used to be,” an idea he previously proposed on his blog. That piqued my curiosity, so I ventured on an effort to do a similar overlay to the Polish one: how do the old Polish and Lithuanian borders with Russia overlap with Ukraine’s current political polarization?

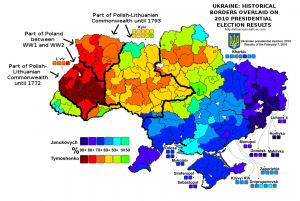
It was more of an effort than I’d have thought. But here is the result, overlaying different historical borders on the 2010 Presidential election results. It turns out that Keegan wasn’t entirely correct about the old Polish-Lithuanian – Russian border – but he definitely had a good point about the continuing salience of historical borders. Check out how the territory that still belonged to Poland in between the two world wars overlaps with the most overwhelming support for Tymoshenko (click the map to enlarge).


Historical borders and the 2010 Ukrainian election map

History as destiny? Historical borders superimposed on the 2010 Ukrainian election map

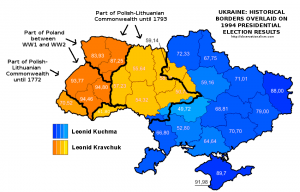
Moreover, Keegan’s point appears more vindicated when looking at the 1991 referendum results, though the division there was merely one between a large versus a near-unanimous majority in favour of idependence, or, especially, the 1994 presidential elections. Here is what the historical overlay looks like for the latter:


Historical borders and the 1994 Ukrainian election map

History as destiny, Pt. II? Historical borders superimposed on the 1994 Ukrainian election map


There are, however, also ways in which history is conspicuously not destiny. Or at least not in ways that are immediately obvious or make sense intuitively. Check out this map of the Holodomor – the genocidal, man-made famine that struck large parts of Ukraine, which is often blamed on indifference or outright malice on the part of Stalin and his regime. Compare it with the post-independence electoral maps, and any overlap is … hard to see. If anything, the Holodomor was most devastating in areas that now habitually side with Russia-friendly politicians like Yanukovich. Which doesn’t immediately make instinctive sense.

Methodological note:

The historical borders are approximate, though I did my best to be precise. As source material I used a map of Northeastern Europe around 1700; a Wikimedia map of the Polish-Lithuanian Commonwealth anno 1789; a Wikimedia map of Poland after the Second Partition of 1793; the detailed 1794 Laurie and Whittle map of the Kingdom of Poland; and an administrative map of Interbellum Poland in 1930. In addition, I used the Wikipedia page and subpages on the administrative raions of Ukraine,  and a detailed Ukrainian Wikimedia map of the electoral multimandate raions of the country. Delineating the far eastern border of the Polish-Lithuanian Commonwealth was a bit difficult since some settlements like the erstwhile Krylov that were right on the border back then have long been submerged in the Kremenchuk dam reservoir. In the south, the problem in defining how the historical border overlaps with current territories, lacking more detailed maps, lies with the transfer of Transnistria to Moldova.

3 Comments

Last men standing, last men down: the fate of two far-left councillors and a mayoral candidate in yesterday’s British local elections

European Politics, Politics

/Disclaimer/: I am not pretending that the events described in this post have a broader political relevance; they are merely meant to satisfy a political anorak’s curiosities.

The last communist councillor in Scotland?

On a random Google trip a number of years ago, I was reading up about the long historical tradition of elected communists in Fife. West Fife was one of only two constituencies in the UK that ever elected a Communist Party MP. And not just once either: Willie Gallacher was the constituency’s MP from 1935 to 1950.

The only other UK constituency to ever elect a Communist Party MP (see addendum) was London’s Mile End, which elected Phil Piratin in 1945, though he only lasted one term. In the same year, Communist candidate Harry Pollitt failed by only 972 votes to take the Rhondda East constituency in Wales. Rhondda, a mining town, was known as “Little Moscow” – but there were “Little Moscows” in Scotland too. (There’s even one in West-Germany, called Mörfelden).

Memorial for volunteers from West Fife who fought in the Spanish Civil War

What I got to reading up about, that particular insomniac night, was whatever happened to that once notorious Communist Party of Great Britain (CPGB). Long story short, its leadership opted for reform in the wake of perestroika and eventually disbanded the party, which in turn left various hardline groups within the party outraged and founding or re-establishing separate parties claiming the CPGB’s heritage: the Communist Party of Great Britain (Provisional Central Committee) and the Communist Party of Britain.

Anyway, the CPGB’s dissolution must have left a couple of local elected councillors high and dry. At some point I noticed that in 1996, a candidate for a group called the Democratic Left polled 30% in the Scottish Hill of Beath local government by-election. The Democratic Left turned out to be the name of a now long-defunct group set up by the reformist last CPGB General secretary. So I read up about Hill of Beath, which predictably turned out to be an old mining village, though the mine has long closed. There used to be a interesting-looking walking route description online about the old pits there, and I also came across this amusing bit of memoir about a Hill of Beath childhood which features a commemorative Lenin bust. I soon found out, via a link that’s long gone offline, that in nearby Ballingry/Lochore a Communist had actually still been elected in 1990 to the Fife regional council. So now, whenever there are local elections in Scotland, out of sheer curiosity, I always check out what’s happening in Fife.

So what did I find this time? Across Scotland, there were still candidates running for the Scottish Socialist Party (SSP), of course, which a mere nine years ago won 7% of the vote Scotland-wide before the whole party fell apart over Sheridan’s scandals. But the party appears to have won all of one council seat this year: Jim Bollan’s on the West Dunbartonshire council. I was looking for something more obscure than that, however: actual communists.

Scotland's last communist councillor?

The Guardian’s results page for Scottish councils lists no SSP candidates for Fife, but does say that 4 “Independent/Other” candidates were elected, down from 6. Hm. The Fife council website offers more detailed results by ward, but for the overall council it just says that 3 “Independents” were elected, drawing 3.8% of the vote. So I went looking by ward, and this one seemed like a possible suspect: the “The Lochs” ward elected a Labour councillor, an SNP councillor, and one William Clarke, party: Other. This is Cllr. William Clarke. But who is he?

Former union official Graham Stevenson runs a website that has many CPGB-related historical resources, including a set of communist biographies. One of them is about Willie Clarke, our man from The Lochs, who turns out to have been first elected as a local councillor for the CPGB in 1973, and has ever since served on local councils: the Lochgelly District Council, the Fife Regional Council, the Fife Council. He must have been that communist who was elected in Ballingry/Lochore in 1990 too. Says the bio:

Willie, having spent his working life amongst miners and playing a very important role within the voluntary groups in the areas has become highly regarded and respected within his community. His extraordinary success at the ballot box bears that out. [..]

After the demise of the Communist Party of Great Britain in 1992, Councillor Clarke sought re-election under their banner of the Communist Party of Scotland. In 2002, he was elected with 1,291 first preference votes, under a new system, or 95% of the vote in Lochgelly in 2003 in The Lochs ward, more or less the same area he has always represented.

Together with another former Communist councillor, the self-styled ‘Democratic Left’ candidate, Alex Maxwell, they have combined in the form of ‘the Left Alliance’, a designation they have assigned to their two man group on the 78 seat Fife council.

So there were two of them? Yep – Alex Maxwell was the guy who got that 30% in the Hill of Beath by-election back in ’96. The same site says:

He is the author of an autobiographical book about the Fife Region, once a strong-hold of British Communism, `ChicagoTumbles’. Although counting himself still as a Communist, as which he was elected a local councillor, Maxwell is not currently a member of any existing party. He has continued to sit as a self-designated “Democratic Left” councillor on Fife Regional Council, having been a member of the authority for a very long time. [..]

Maxwell represents Cowdenbeath Central; he is a former Town Councillor for Cowdenbeath and a District Councillor for Dunfermline, Fife since 1995, representing Cowdenbeath’s Ward 8. In May 1996, in a County Council by-election in the Hill of Beath ward, Maxwell took over 30% of the vote, in what had previously been a rock-solid Labour ward. [..]

In the Fife council elections of May 2007, 78 wards were reduced to 23 with three or four councillors to sit in each ward. Maxwell received 1350 first preference votes, by far the highest number, with other successful candidates being spread across the establishment parties.

But why doesn’t he show up in this year’s results, then? Alas, Google cache still has the backup of a local news story from last month: “Three retiring councillors from the Cowdenbeath Area Committee were given a warm send-off from the last meeting before the elections by chairman Willie Clarke,” and they included Maxwell.

So .. is Willie Clarke, one of three councillors elected in The Lochs ward for the Fife local council, the last Scottish communist standing, in elected office at least?

Erasing the last of the Militants: Dave Nellist defeated in Coventry

The Guardian’s election results page for English local councils says that the “Socialists” lost their lone councillor among Coventry’s 54 council members. This rang a bell, since I half-remembered something from some other random Googling about locally elected English far-lefties, a few years ago. (Yes, I do a lot of random Googling).

Dave Nellist's old-time Marxist religion

Indeed, Wikipedia comes to the rescue: the man who lost his local council seat yesterday was no less than the once-famous/notorious Militant politician Dave Nellist, who was an MP from 1983 til 1992, when he was expelled from the Labour party. After he was expelled, he ran for his seat as an independent Labour candidate and got a decent 29% against the winning official Labour candidate’s 33%. On subsequent successive general election runs, however, he remained stuck at 4-7%.

Instead, Nellist and his friends from the Trotskyite Socialist Party focused on the local Coventry council. By 2006, the Socialist Party won all three seats of the heavily deprived St. Michael’s ward.

This was a notable bit of far-left trivia, since this ward was one of only two across the entire UK in which the Socialist Party’s brand of Trotskyism won any local council seats. The other one was Telegraph Hill in London Lewisham. That’s how I ended up on this particular Google trip in the first place, actually: I’d dug into the 2006 local election results for London and noticed that Telegraph Hill was, among 624 London wards, the one with the largest share of votes (50.6%) going to parties to the left of the three mainstream ones – the Trots, running under the Socialist Alliance banner, won 35% of the vote and the Greens 16%. (I actually hopped a suburban train to Telegraph Hill last time I was in London to check out what kind of neighbourhood it was. It’s a nice place.)

Even the SP’s local success was not to last though, as I already suspected when, at the time, I ended up reading about a massive urban regeneration project in Coventry’s Hillfields neighbourhood, which is within the St. Michael’s ward and would presumably bring yuppies into the area. As it turns out, Nellist’s Socialist Party colleagues in Coventry were defeated in the local elections of 2007 and 2010, respectively. The two SP councillors in London’s Telegraph Hill were kicked out in 2010 too, which appeared largely due to turnout being twice as high as usual – I think because the local elections were held simultaneously with the national ones that year, which benefited Labour.

And now, although the vote count was close with the Labour candidate winning by 1,673 votes to Nellist’s 1,469 and Nellist actually got more votes than last time, he is gone too – even from the local stage, ten years after he disappeared from Westminster.

Militant legacy in Liverpool, spurned as well

But wasn’t there another Socialist Party member and former Militant leader running for something this year? Yes. Liverpool voted for its first elected mayor this year. Labour’s Joe Anderson handily won the race with a whopping 59% of the race. Among the losers, in fifth place: Tony Mulhearn, running on a Trade Unionist and Socialist Coalition (TUSC) ticket, got 4,792 votes, or 4.86% of the vote.

Tony Mulhearn, still protesting cuts

Tony Mulhearn was President of the Liverpool District Labour Party back in the 1980s, and a leading figure in the city council’s volatile fight with Thatcher’s government at the time. Militant was in control of Liverpool’s Labour majority back then, and it set a course for conflict in a bitter budgeting crisis when its councillors refused to make any of the cuts which Thatcher’s reduction of city budgets made necessary. The Militant leaders instead insisted that refusing to pass a budget was the best way to force the national government to give in and fund the needed resorces after all. When Thatcher refused and Liverpool’s money ran out, the council was forced to abruptly sack hundreds of city workers and cease city services, leaving streets filled with rubbish. In a particularly weird part of the story, the city had to rent taxi cabs to deliver termination letters to city employees.

I should warn that the above paragraph is from memory. At some point I spent too much time reading through various accounts of these events, some lauding the city council’s principled resistance against Thatcher, others blaming it for chaos engulfing the city, but I’m done digging links back up for now. In any case, the whole episode played a crucial role in the Labour Party under Neil Kinnock deciding to clamp down on the Militant tendency once and for all, eventually leading to Nellist being shown the door too.

It has not been forgotten either. When the Guardian gave each mayoral candidate the space to lay out his/her case, Mulhearn’s contribution evoked how, back in his time, “the Liverpool Labour council .. took on Thatcher and won £60m for the city from that government,” whereas now, “the coalition government is much weaker than Thatcher was, and yet Joe Anderson’s Labour council has not taken them on. [..] Far from standing by the people of Liverpool, Anderson and his party have sided with the ConDem axe men.” But at least one reader remembered things a little differently:

You are no champagne socialist, I’ll grant you that, but I remember your days back in the 80s, I was at school in Liverpool then. Or at least I should have been, our whole class was always getting sent home as your mismanagement of the schools and political brinkmanship with the livelihoods of your workers led to massive levels of absenteeism amongst the teachers, the buildings, facilities and equipment declined by the day, basic council services weren’t delivered, the streets piled up with rubbish whilst your binmen played football in the park and you, Degsie and your gang of brownshirts went around threatening and physically intimidating anybody who dared to object to your tactics.

I’ll never forgive nor forget you for the damage you did to the lifechances of people like myself who were approaching adulthood then. Small wonder that so few of my school generation live in Liverpool now, for the damage your regime did to economic life in the area. The last thing the city needs, after two decades of slow recovery, is you lot rearing your ugly heads again.

I’m no Tory, I’ve plenty enough issues with them going back to that era, and I am appalled by the severity of the cuts applied to Liverpool by the current government. But nobody should be under any illusion about where your style of leadership will take the city. We’ve been there before and we shouldn’t forget.

That comment, in turn, triggered a flurry of much more favourable recollections. “Liverpool in the 80s was a beacon of hope for the working class and at the time it was more isolated than it would be today,” wrote one counter-commenter. “The Tories, let’s remember, wanted ‘managed decline’ of Liverpool. Labour transformed the fabric of the city [..]. Many Liverpudlians have reason to be glad of the Labour council as they are still living in those council houses – Liverpool built more than the rest of the country put together,” wrote another. “The Liverpool 47 stood up to the Tories and fought for the people of Liverpool,” wrote a third, crediting Mulhearn and his colleagues for “6,300 families rehoused from tenements, flats and maisonettes [..], 4,800 houses and bungalows built, 7,400 houses and flats improved, [..] £10million spent on school improvements, [..] three new parks built, rents frozen for five years”.

True or not, it’s twentyfive years later now, and none of that is apparently worth more than 4.9% of the vote, even in once-Militant Liverpool.

When reds turn to green (and not necessarily the ecological kind)

No, if you like your politics protest-flavored and socialist red, the traditional far left offers little solace. The only comfort for the Trade Unionist and Socialist Coalition (TUSC), which sponsored Nellist’s and Mulhearn’s runs, is that two other TUSC candidates regained local council seats they’d lost last year. In Wallsall in the Midlands, a candidate from the local Democratic Labour Party, a group of far-left socialists led by “Citizen Dave” who were expelled from the Labour Party in the late 90s and recently joined TUSC, won back a council seat after having previously served from 2007-2011; and in Preston, Lancashire, a candidate from that better known British Trotskyist party, the Socialist Workers Party (SWP), won back a council seat after previously serving from 2003-2011.

Neither of the two Socialist Party candidates running for constituency seats in the London Assembly got more than 2%. A seemingly new group called People Before Profit (possibly inspired by the energetic Irish group of the same name [EDIT: A commenter has weighed in to say this was not the case]) did a little better:  its colourful candidate Barbara Raymond received 5.2% of the vote in her failed run in Lewisham for such a London Assembly seat. That’s about it, though.

Respect campaign, Bradford

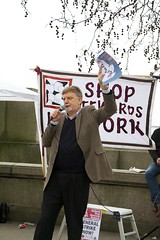
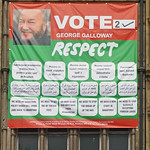
Instead, you’d want to look at more unorthodox movements. George Galloway’s Respect coalition, fresh off Galloway’s own by-election victory in Bradford West last month which saw him return to the UK parliament after two years, won five local council seats in Bradford yesterday. That’s still just 5 out of the 30 seats that were up for grabs this year, and just 5 of 90 seats on the council overall (Labour has 44 or 45). But it got them plenty of press, since one of the scalps they took was of the Labour Party’s incumbent council leader, as three recounts confirmed, leading Galloway to crow that Respect had “taken the head off the rotten fish that is the Bradford city council”. The Bradford local campaign also drew attention by allegations of physical assaults. A LibDem candidate and a local LibDem MP both made police complaints saying they’d been harrassed by Respect campaigners, and the MP in question compared Respect with the BNP, saying “we got rid of them and we’ll get rid of these thugs too.” Vice versa, a Respect campaigner said he had been assaulted by Labour supporters.

The success of Respect in Bradford is rooted in strong support from the local Muslim community, just like it had been in London’s Eastend when Galloway was first elected as Respect MP in the Bethnal Green & Bow constituency. All five newly elected councillors appear to be Muslim. Video footage of Respect’s islamic-green battle bus apparently showed Respect campaigners calling their Labour counterparts “criminals who have murdered a million Iraqis”. The local Respect campaign also came with its own hip-hop track, “Bradford Spring”.

Respect did not run candidates in Birmingham, where its candidate Salma Yaqoob got a quarter of the vote when she ran for MP in the Birmingham Hall Green constituency in 2010. Instead, Respect supporters in the largest city of the Midlands should this year vote for Green Party candidates, Yaqoob had said last month. They didn’t listen: Labour won 29 of the 40 seats that were up for grabs this year, and the Green Party none. The electorates which the Greens and Respect appeal to are just too different altogether.

Leanne Wood, Mike Moore

There is one more, probably unexpected place a far left afficionado might look: Plaid Cymru, the Welsh nationalist party. Plaid’s party colour is also green rather than red, but they elected a new party leader just two months ago, and Leanne Wood is a little different from the previous leaders of a party originally associated with romantic nationalism and a fervour to keep the Welsh language alive. She doesn’t even speak Welsh fluently. She’s from the region’s proletarian, Labour-friendly south rather than the more rural expanses further north; she very effectively used social media in her leadership campaign; and she’s a feminist, an anti-war activist, a socialist, and a republican. (She was once ordered to leave the Welsh Assembly after she called the Queen “Mrs. Windsor”). In fact, Wood is from Rhondda, Wales’ own former “Little Moscow”.

Unfortunately, Plaid fared rather poorly yesterday. With Labour romping home across much of Wales, Plaid had to concede some 41 of its 199 previous council seats. In Wood’s native Rhondda, Plaid actually lost half of its 18 seats, with Labour increasing its share from 48 to 60 (and the Tories holding just 1). Still, the 158 council seats Plaid has left is a hell of a lot more than Respect, TUSC and all the other left-of-Labour socialists together could hope to collect in many years. Even the Green Party, which looks set to win an additional 11 seats to get a total of 40 across England and Wales, doesn’t come close.

Labour, meanwhile? It seems set to win an extra 800+ seats or so yesterday alone, and will have well over 2,000 council seats across England and Wales after these elections. Even with the newly fragmented British electorate, everyone else on the left is just tinkering on the margins.

Addendum

Commenter ResoluteReader chimed in to correct me: whereas Gallacher and Piratin were the only communists ever elected as MPs since World War 2, two communist MPs were elected earlier on: Shapurji Saklatvala in Battersea North and Walton Newbold in Motherwell. Both were elected in the 1922 elections and then defeated again in the next general elections a year later, in 1923; but Saklatvala returned to parliament in 1924, before being defeated again in the next elections in 1929. If the Wikipedia articles about the two are to be trusted, however, at least Saklatvala had been endorsed by the Labour Party as its candidate as well when she was elected; the two articles disagree about whether the same was true for Newbold. In either case, the Labour Party fielded no opponent against either Saklatvala (in neither of her winning runs) or Newbold. This makes their cases substantively different from Gallacher’s and Piratin’s, who both had to defeat Labour as well as Liberal and/or Conservative opponents to get into the House of Commons. (return to text)

8 Comments

Berlin: polls, pirates and the electoral geography of last weekend’s elections

European Politics, Politics

There were state elections in Berlin, the capital of Germany and one of three city states among Germany’s 16 states, last weeekend. The results were somewhat surprising and fairly pleasing, and since I made a couple of maps that I have no place to put, I thought I’d revive our old blog.

Berlin: The Result

Official preliminary end results, courtesy of the Landeswahlleiter:

Social-Democrats (SPD)      28,3%   (-2.5%)
Christian-Democrats (CDU)   23,4%   (+2.1%)
Greens                      17,6%   (+4.5%)
Left Party                  11,7%   (-1.7%)
Pirate Party                 8,9%   (+8.9%)
NPD (extreme-right)          2,1%   (-0.5%)
Free-market liberals (FDP)   1,8%   (-5.8%)
Animal Protection Party      1,5%   (+0.7%)
pro-Germany                  1,2%   (+1.2%)
"Freedom" (far-right)        1,0%   (+1.0%)
The Greys (pensioners)       xxx    (-3.8%)
WASG (left-wing)             xxx    (-2.9%)
Others                       2.5%   (-1.2%)

In all, 69.3% for left-of-centre parties, 29.7% for the right, and the remainder for hard-to-classify parties like the Alliance for Innovation and Justice (BIG), which received 0.5% but over 10% in some precincts (see below), and appears to be a conservative Muslim party.

Regarding that 69% (oh, juicy) for the left, there’s a certain joy in just exclaiming: “hey, it’s Berlin!”. But even for Berlin this is an unusual result. In 2006 and 2001, the main leftwing parties pooled about 60% of the vote, and in 1999 only some 50%.

Basic backgrounds

The Social-democratic win seems largely due to the personal popularity of Mayor Klaus Wowereit, who was the center of a campaign largely focused on appealing to a kind of feel-good local patriotism. The party’s slogan was “Understanding Berlin,” which was also a bit of a dig against the Greens, who had parachuted one of their national party leaders, Renate Kunast, into the race. Kunast decided to challenge Wowereit at a time when polls suggested a neck-and-neck race between the two parties, with the once-dominant Christian-Democrats fading into third place. But Wowereit seems to have easily won the election campaign, with the last few polls showing his SPD at some 30% of the vote, the CDU at just over 20% and the Greens at just under 20%.

Some pundits have blamed Kunast’s dogged aura of ambition and overly slick campaign, which proved an ill fit for challenging Wowereit, whom the New York Times once described as “charming, sociable and openly gay” and “a cuddly symbol of Berlin’s openness and tolerance”. At least as important, however, is probably how Kunast’s refusal to rule out a coalition government with the right-wing CDU chased parts of the Greens’ traditional alternative-lefty electorate into the arms of the Pirates.

All that said, compared to five years ago the Greens actually won votes, and the SPD lost some. It’s actually the Greens’ best result in unified Berlin yet. It’s just that at a time that the Greens poll at around 20% nationally, getting less than that in the country’s Mecca of alternative culture is distinctly underwhelming.

Despite their rivalry, the SPD and Greens still look likely to form a coalition government now, replacing the previous “red-red” coalition of Social-democrats and Leftists which no longer has a majority. But due to the surprise success of the Pirates, the two parties have ended up with an unexpectedly narrow majority of 76 to 73 seats. The two parties are sharply divided about the extension of a major highway, and theoretically the Social-democrats could still opt for a more ample majority government with the CDU instead. That would leave the entire opposition in the state parliament to the government’s left, however, and would probably be frowned on by the national SPD, which is keen to unambiguously set the course for a red-green government after the next federal elections.

Meanwhile, the digital-rights Pirate Party has easily harvested the most international headlines with its shock success. If you don’t remember, the Pirates drew a fair bit of attention when a Pirate Party received 7% of the Swedish vote in the 2009 European Parliament elections. Subsequent electoral gains have been scarce, however: in the 2010 national elections in Sweden, for example, the Pirate Party received just 0.7% of the vote. Pirate Parties did win a number of municipal council seats in Germany, the Czech Republic, Spain and Switzerland, and the German Pirate Party received 2% of the vote in both the 2009 German national elections and 2011 elections in the states of Baden-Württemberg and Hamburg, campaigning on opposition to new data retention and Internet filtering policies. But this result is easily the Pirate Parties’ biggest coup since they first broke through.

The result of the Left Party – a coalition of East-German ex-communists and West-German disgruntled trade unionists and other leftwingers – is a far cry from the 20+% which the ex-communist PDS received ten years ago. Especially in its core East-Berlin constituency, the party’s support has plummeted: it went from 48% of the East-Berlin vote ten years ago to 23% now. That’s the worst the post-communists have done there in state elections since the unification of Germany. The party’s result is also worse in comparison to 2006 than it may look at first sight: the Left Party has absorbed the WASG since the last elections, so you should really compared its result now to their pooled results five years ago.

The Left’s decline could have various reasons. The WASG voters from 2006 seem to not have made the transition to the Left Party, and the Left lost relatively many voters to the Pirates. Having been  Wowereit’s junior government partner for the past ten years, the Leftists have lost much of the critical left-wing profile they combatively honed in the 90s. Or who knows – maybe the eroding numbers for the Left could also be a sign that “Ostalgia,” and the resentment which the city’s “Ossis” feel of the know-it-all yuppies from the Western half of the city in particular, are fading. It’s been a while since the battle over the traffic light men.

The extreme-right NPD, which is opposed to funding for commemorations of fascism, made waves with election posters that subtly featured the party’s leader on a motorbike and the slogan “Giving gas”, which the party’s activists made sure to plaster near synagogues and the like. It lost some support, however, getting 1.6% of the vote in West-Berlin and 2.9% in East-Berlin (down from 4.0%).

For far more interesting information about these elections, check out the Berlin post on the ever reliable World Elections blog.

East vs West

There is still a massive difference between the voting behaviour in West-Berlin and East-Berlin, but it has gotten a lot smaller over the past ten years, thanks to the implosion of the post-communists in East-Berlin.


SPD CDU Greens Left+WASG
/PDS
Pirates FDP Others

West Ost West Ost West Ost West Ost West Ost West Ost West Ost
2011 28.0 28.8 29.5 14.2 20.4 13.5 4.3 22.6 8.1 10.1 2.3 1.2 7.4 9.6
2006 31.4 29.8 27.7 11.4 14.8 10.5 6.9 31.4 9.3 4.9 9.9 12.0
2001 33.7 23.2 30.8 12.4 11.1 5.9 6.9 47.6 12.8 5.3 4.7 5.6
1999 25.2 17.8 49.3 26.9 12.1 6.4 4.2 39.5 2.8 1.1 6.4 8.3
1995 25.5 20.2 45.4 23.6 15.0 10.0 2.1 36.3 3.4 1.1 8.6 8.8
1990 29.5 32.1 49.0 25.0 8.2 11.4 1.1 23.6 7.9 5.6 4.3 2.3

Data 1990-2001: http://www.wahlen-berlin.de/historie/Wahlen/Landeswahlleiterbericht_AH2001.pdf
Data 2006: http://de.wikipedia.org/wiki/Wahl_zum_Abgeordnetenhaus_von_Berlin_2006
Data 2011: http://www.wahlen-berlin.de/wahlen/BE2011/Ergebnis/region/Regionen.asp?sel1=1052&sel2=0655

Polls and Pirates

The Pirate party easily outdid all but the very last poll, which was mocked as unrealistic at the time by political enthusiasts. The Greens, the free-market liberals of the FDP and especially the Social-democrats, on the other hand, did worse than the polls had suggested. Some SPD voters may have started taking their party’s victory for granted and not bothered to come out, while a few FDP voters may have switched to the CDU when they saw that their party was unlikely to cross the 5% electoral threshold. (The CDU was the only other party to outperform the polls, if only by a sliver.)   It was undoubtedly the Pirates’ success that did the most to keep the other parties’ vote lower than expected though.

An analysis of voter ‘traffic’ by pollster Infratest dimap suggests that the Pirates primarily rallied non-voters (23,000) and voters of other minor parties (22,000). In addition, however, the Pirates won some 17,000 voters from the Greens, some 14,000 from the Social-democrats, and 13,000 from the Left. Those 22,000 voters that the Pirates won from other minor parties are interesting, by the way. The two main minor parties last time that did not take part this year were the Greys – a party for the elderly – and the WASG, which received some 40,000 votes. Since Pirate Party voters are the youngest of any party’s, it’s unlikely that they got much cross-over support from the Greys, so that would suggest that these 22,000 largely come from the WASG. In fact, the Infratest dimap analysis suggests just a net 2,000 voters going from “other parties” in 2006 to the Left Party now.

Argh! The cost of success

The Pirates have won 15 seats – which is good, because they didn’t have more than 15 candidates on their city-wide list.  In fact, they will have to forego on taking up a number of seats they won in the local district assemblies, because they didn’t have enough candidates listed.

One poignant case in question is the district of Friedrichshain-Kreuzberg, where the Pirates did best. They won nine seats in the district assembly, which is enough to qualify them for one of the five positions (Stadtrat) on the district administration, which apparently are appointed proportionally. But first off, the Pirates had only eight candidates on its district list, so they can not fill one of their seats at all. Moreover, three further Pirates have been elected to both the Berlin city parliament and the F’hain-Kreuzberg district assembly, and they will have to choose which of the two offices to accept. In order to fill all of the Pirates’ 15 seats in the city parliament, all the double-electeds will have to give that job priority to the district-level one. That seems like an easy choice, except that if the three double-electeds from F’hain-Kreuzberg make that choice too, their caucus in the district assembly shrinks to five … and they lose their proportional post on the district administration to the Left Party. The perils of success!

My favorite Berlin neighbourhoods

Friedrichshain-Kreuzberg may be my favourite electoral district of any kind anywhere.  It’s got some 268,000 inhabitants, so we’re not just talking about some small niche community. And it is reliably the most leftwing district of its size, I dare guess, in Europe. Among other things, it elected Germany’s first constituency MP for the Greens in 2002 (when the party had previously only MPs elected over party lists), and not just any Green either: Hans-Christian Ströbele.

This time, the results in the district were as follows: Greens 30%; SPD 24%; Pirates 15%; The Left 13%; CDU 8%; and the satirical PARTY party 2% – or a total of 87.1% for left-wing parties…

Who would you have voted?

If you speak German you can check for yourself what you should have voted by using the Wahl-o-Mat for these elections. Predictably, I got the Greens first (74 out of 86) and the Left directly after (71 out of 86), though if I include the various miniscule splinterparties, a couple of extreme-left parties (B, DKP and PSG) manage to squeeze in between the two still.

Hot spots

Various German news sites have published electoral maps showing the winner by city district. There are also great maps showing the winner, and party strengths and weaknesses, by individual city parliament electoral district. I like these ones on the US Election Atlas site (of all places) best.

For the heck of it, however, I downloaded the excel sheet with results by individual precinct (as opposed to just by city district or city assembly electoral district). If you are interested in this level of detail, one site to look up for sure is the election.de section on the Berlin elections. Click on any city assembly electoral district, and you get a map of winners by individual precinct. It’s fairly rare to see electoral maps on that level of detail.

Myself, I was mostly interested in which individual precincts were the best for each of the main parties – hence downloading the excel sheet. I only looked at actual, walk-in polling stations, and not at the processing of votes by mail; and I looked at the party list vote (“Zweitstimme”), in order to reduce the effect of a particularly popular local candidate (the election.de precincts map show the results by “Erststimme,” for individual candidate). The result: this map, which shows the top 5 results of the top 5 parties – though you’ll have to click on it to see it in full size.

Colour coded as obvious for Germans: red is the SPD, black the CDU, green the Greens, pinkish the Left and orange the Pirates

I colour coded the pins according to party colours: red is the SPD, black the CDU, green the Greens, pinkish the Left and orange the Pirates.

Kreuzberg vs Friedrichshain

Interestingly, both the Greens and the Pirates did best in the city district Friedrichshain-Kreuzberg, but their bulwarks were on opposite ends of the district.

  • The Greens received 48% of the “second vote” in a precinct by the Fidicinstrasse, in South-West Kreuzberg. Four of the party’s top 5 results are in that part of Kreuzberg, in fact; and a full eight of its top 10 precinct were in Kreuzberg overall.
  • The Pirates received 26% of the vote in a precinct covering the few blocks around the Boxhagenerplatz, in the heart of Friedrichshain. (I think I was at a festival in the little park there once). More strikingly, three of the Pirates’ top five results and all of eight of its top 10 results were in Friedrichshain.

Highrises and suburbs

  • The Left Party received 43% of the vote in a precinct by the Schottstrasse in the Lichtenberg neighbourhood. All of four of its top 5 precincts were in the city district Lichtenberg, though its sixth-best result, at 41% of the vote, was in a precinct at the beginning of the Karl-Marx-Allee, just off Alexanderplatz. Judging on Google Street View, the party’s top two precincts are located amidst low-rise post-war housing blocks, while its third-best precinct is all major highrises.
  • The SPD received 46% of the vote in a precinct among some mid/highrises by the Michelangelostrasse and Gurtelstrasse in upper Prenzlauer Berg / Weissensee. Yes, that’s in former East-Berlin, but the numbers 2 through 12 of the top precincts were all in West-Berlin. SPD precinct #2 is located amidst highrise blocks in Wedding; its precincts #3-4 consist of more highrise blocks, but in the suburb of Spandau. Six of the next nine top SPD results are in Spandau too.
  • The CDU received 52% of the vote in a precinct by the Bernadottestrasse in Wilmersdorf. Very leafy: a clearly prosperous area. The party’s top 3 precincts actually covered adjoining ground: each covered bits of Grunewald / Schmargendorf that border the Berliner Forest.

What about the smaller parties (and we can include the FDP under that nomer now)? Let’s include the top 5 precinct results for the NPD and the BIG, which are all over 10%; as well as the one (1) precinct result where the FDP got over 10%:

Now with the NPD (brown), FDP (yellow) and BIG (dark green)

Now with the NPD (brown), FDP (yellow) and BIG (dark green)

  • The only precinct the FDP received more than 10% of the vote in is located in Steglitz-Zehlenforf, bordering the Berliner Forest. Its next four best results were all in Charlottenberg-Wilmersdorf, similarly close to the forest, and two of them were also among the top 5 results for the CDU. Rich people, basically.
  • The extreme-right NPD received 14% of the vote in a precinct by the Hugelschanze in Spandau Neustadt: an inconspicuous looking couple of streets, judging by Google Street View, fairly green, midrise buildings with a bit of graffiti. That’s in the West, but the party’s runner-up results #2-3 (12-13%) were both in Treptow-Kopenick, and its results #4-5 and #7-10 (10-12%) were all in Marzahn-Hellersdorf, all in the East. Its Treptow-Kopenick bulwarks consist of neatly kept-up post-war mid-rises and highrises, while its two best scores in Marzahn-Hellersdorf are adjoining plots of major highrises on the edge of the city.

On the populist-xenophobic (but not outright fascist) right,

  • pro-Deutschland received 7% of the vote at a voting station in Marzahn-Hellersdorf, and some 5-6% in a total of around 15 further precincts, two-thirds or so of which were in either Spandau or Marzahn-Hellersdorf.
  • FREEDOM received 9% of the vote in a precinct around the Idunastrasse up in Heinersdorf, city district Pankow. It received 8%, 5% and 5% of the vote, respectively, in three adjoining precincts in Heinersdorf, and also 5% at a polling station in Marzahn-Hellersdorf.

Odd one out

The conservative-Muslim BIG party, which is being tied to the Turkish government party AKP and campaigned for migrant rights but also against the alleged promotion of homosexuality in schools, received just tenths of a percentage point on a city-wide level. But it won as much as 10-15% in ten precincts. Eight of them were in the city districts Mitte or Fr’hain-Kreuzberg; it seems to have done well in Wedding in particular. Its best result, however, was in a precinct in Neukolln, around the Heinrich-Schlusnus-Strasse, which in Google Satellite View looks like a 1970s architectural experiment gone horribly wrong.

1 Comment

Budapest riots: not what they used to be anymore

European Politics, Politics

— Crossposted from Cogitamus —
It’s March 15, a national holiday, and police was duly out in massive numbers to guard the some twenty different, mostly oppositional, manifestations that took place. March 15, on which Hungarians commemorate the 1848 uprising against their Habsburgian overlords, is one of the two or three most volatile days in this country. There’s always a great number of protest manifestations (especially if there is a leftwing government), and the last couple of years there was widespread rioting.

Which is why today was a bit of a disappointment, really.

I was sort of ready to ignore the festivities already, since after two and a half years and a dozen iterations, the demo-cum-riot scene has jumped the shark. It’s always the same anyway: angry grannies and families with Hungarian flags in the afternoon, hooded and balaclavad youths in the evening, when the mainstream conservative politicians sternly intoning their dire warnings make way for younger rabble-rousers, who shout about PM Gyurcsany, the commies, the police and the Jews. Demonstrators who look like the kind of mix of students and squatters you’d get in a far-left demo in Western Europe. Much posturing, waiting around, exchanging of tall tales, waving flags and shouting slogans; not to mention trying to impress the far-right girls, who are surprisingly cute. Marching this way and that, avoiding the police, building barricades, and then the inevitable show-down; teargas, batons, the crowd tearing back with scarves over their mouths. A lengthy cat-and-mouse game, as the rioters taunt the cops and pelt them with stones, until the dull thuds of tear gas grenades being shot into the crowd set everyone running again. Only for the game to start over twenty minutes later once the dust is settled. Rinse and repeat.

Nevertheless, I did keep an eye on the website of the Magyar Nemzet, a national-conservative newspaper which at every new iteration publishes a breathless minute-by-minute account of goings-on in the city. Very practical if you want to know where the riots are at any given moment. Not saying they actively incite the rioters, but … OK, who am I kidding, they do.

But it was thin gruel today. No large street battles, no kidnapped tank being driven around by demonstrators. A year ago, and two years ago, rioters would control sections of major thoroughfares downtown a mile long, rocks would rain down on the police shields. Barricades would be built, phonebooths felled and used as material, Molotov cocktails hurled. This time there was basically one violent clash of sorts, in the late afternoon near the Saint Stephen’s Basilica, around the corner from my work. Which was quickly smothered by an overwhelming police presence, with the riot cops easily outnumbering the rioters. (They’ve been recruiting).
By the time I bothered to haul myself over to the area, it was kind of sad really. Clumps of protestors, hanging around in small groups. Barely a flag among them, though there was a guy or two in a Hungarian Guard uniform. No chants of “Gyurcsany, bugger off”. Just waiting, cracking the odd joke but generally sharing a desultory mood. Warily watching the columns of riot police, clad in black, that blocked off the sidestreets. Sometimes a unit, upon barked commands, rattled off in a lockstep run, or moved into place. The whole street lined with police cars, vans, a whole bus arriving with fresh manpower.

289826234_ccd9217327_o[1]

Blurry images from the 2006 riots

Some grannies, the national tricolor pinned on their chest, heckled the cops; a drunk in camouflage slurred insults. We pay you, our taxes, now look at you. But mostly, the status quo was complete. A far right teen, in the practical combat-ready outfit of boots, thigh-highs and skirt, posing for the photo with her girl friend; a guy in near-folkloric nationalist outfit jollying around in mock-poses when I turn my camera his way. On the other side, the helmeted cops are painstakingly polite to anyone with a camera or otherwise visibly not part of the scene. Hard to imagine these were the troops who two years ago were condemned by Amnesty International for violent abuse of demonstrators they had carted off in their vans: they allegedly handcuffed and lined up rows of suspects on their knees, and beat them with truncheons. Though they do still look the part, and at one point wrestled someone from the crowd and violently pushed and shoved him into one of the waiting vans.

Generally though, the police seem to have learnt a lot, these past two years. In the first round of rioting, when protestors briefly occupied the building of Hungarian Television, more cops were injured than protestors. Night after night, they were hunting after bands of rioters running amock, unable to do more than chase them off to ever new places. Now, they seem in full control. What are they doing differently now? Lesson one: overwhelming numbers. Have a disproportionate presence vis-a-vis the rioters. Outnumber them in such proportions, they’re intimidated before they even start. Lesson two: preempt their moves. Smother even the slightest rioting before it escalates. Block off entire neighbourhoods if need be. Lesson three, and this may seem paradoxical: mingle. Well, mingle is perhaps not the right word. But again and again, a point arrived where a phalanx of riot cops crossed the street or jumped out of a bus — not, in old school style, to form a big line of shields and then push the protesting youths into a pack and then backward — but to mix into the crowd. With one cop for every protestor, noone even thinks of resistance as the cops scatter and demand ID from every youth, and frisk many of them.

Of course that’s only possible thanks to their force of numbers. And how this fits with your various civil rights, I don’t know. I’ve never been asked to ID myself just for gathering in protest when taking part in demonstrations back home – and that’s all these kids were doing, by the time I arrived.

Hear me, I’m defending fascists now. And there is genuine reason to worry about the flourishing far right movements, with the Hungarian Guard ceremonially inducting 650 new members today. Just two days ago, a right wing group called the Hungarian Arrows Liberation Army (named in reference to the WW2-era Arrow Cross regime) claimed responsibility for a bus explosion in Bács county. The group said it had wanted to punish a local coach company that had transported a group of Roma “marching against Hungarians” to a demonstration in Ózd, in order to “avenge the anti-Hungarian sentiment”. In all, four people have been killed in seven recent attacks against Roma.

The silent majority, meanwhile, is just disgusted with it all. A Eurobarometer poll published last month showed that just 16% of Hungarians trust their national government – compared to 45% who trusted local and regional authorities and 51% who trusted the EU. More damningly, a national pollconducted last month showed that “all Hungary’s politicians [..] have negative ratings”. Neither the President, a conservative, nor the Prime Minister, a socialist (albeit, as is the case with many ex-communists in the region, one who has embraced the market reform with a passion), was evaluated positively. Nor was the Speaker of the Parliament – or any of the main opposition leaders.

Nor does it seem to be a particularly ideological matter. While the conservative opposition party Fidesz “towers above all the other parties” in the poll, the least impopular politician is actually a Socialist. Moreover, it’s Katalin Szili, the parliamentary speaker who often criticizes PM Gyurscany … from the left. So the Hungarians don’t agree whether the answer lies to the left or to the right, they just know they’re fed up with what they have now. Which neatly summarises the political history of postcommunist Hungary, come to think of it.

Comments Off on Budapest riots: not what they used to be anymore

Fear the Vlad

Culture, European Politics, Politics

(Yes, I know everyone else already tried out Obamacon.me a month or two ago…)

Comments Off on Fear the Vlad

The shooting party

Culture, European culture(s), European Politics, Politics

The Tagesspiegel reports that Hell’s Angels and militant neo-Nazis are fighting out a bloody feud in the northernmost German state of Schleswig-Holstein.

It all apparently started in 2007, when a Nazi stabbed a Hell’s Angel in a fight over debts, and the Hell’s Angel barely survived. The trial about that case was supposed to take place last August, but had to be suspended when dozens of neo-Nazis and Hell’s Angels battled it out in front of the court house. During that fight, Peter Borchert stabbed a leading Hell’s Angel. Borchert is the former chair of the National Democratic Party, which received 2% of the vote in the last elections in the state. He’s already done a stint in jail for illegal arms trade.

Now two unknown, masked men have shot the brother of the Nazi who started it all back in 2007 – and who was supposed to testify in the court case. He was shot on the parking place of a swimming pool.

The Tagesspiegel dryly notes that the Angels are “involved in activities related to tattoo studios, gastronomy, bouncer services, fight sports and online mail ordering” as well as connections with the prostitution sector and, it is suspected, illegal anabolics trade … “to some extent there are overlaps in the above-mentioned commercial sectors with members of the extreme right.”

Right.

So … how wrong is it if, as a normally passionate proponent of the rule of law, you’re not all too bothered when neo-Nazis and Hells Angels start taking each other out?

Bernd the Bread, with friends

Bernd the Bread, with friends

In other news from Germany today, a two-metre high statue of Bernd the Bread, a local children’s show character, was found back in abandoned barracks after protesting squatters kidnapped it from the town square of Erfurt two weeks ago.

1 Comment
« Older Posts
Newer Posts »